Int. J. Dev. Biol. 66: 211 - 222 (2022)
Special Issue: Developmental Biology in Greece
Repression of differentiation genes by Hes transcription factors fuels neural tumour growth in Drosophila
Original Article | Published: 22 November 2021
Abstract
Background: Neural stem cells (NSC) in divide asymmetrically to generate one cell that retains stem cell identity and another that is routed to differentiation. Prolonged mitotic activity of the NSCs gives rise to the plethora of neurons and glial cells that wire the brain and nerve cord. Genetic insults, such as excess of Notch signaling, perturb the normal NSC proliferation programs and trigger the formation of NSC hyperplasias, which can subsequently progress to malignancies. Hes proteins are crucial mediators of Notch signaling, and in the NSC context they act by repressing a cohort of early pro-differentiation transcription factors. Downregulation of these pro-differentiation factors makes NSC progeny cells susceptible to adopting an aberrant stem cell program. We have recently shown that Hes overexpression in Drosophila leads to NSC hyperplasias that progress to malignant tumours after allografting to adult hosts. Methods: We have combined genetic analysis, tissue allografting and transcriptomic approaches to address the role of Hes genes in NSC malignant transformation. Results: We show that the E (spl) genes are important mediators in the progression of Notch hyperplasias to malignancy, since allografts lacking the E (spl) genes grow much more slowly. We further present RNA profiling of Hes-induced tumours at two different stages after allografting. We find that the same cohort of differentiation-promoting transcription factors that are repressed in the primary hyperplasias continue to be downregulated after transplantation. This is accompanied by an upregulation of stress-response genes and metabolic reprogramming. Conclusions: The combination of dedifferentiation and cell physiology changes most likely drive tumour growth.
Keywords
neural stem cells, CNS tumour, Hes proteins, Notch, Drosophila
Introduction
Cancer growth in many solid tumours (e.g. neural tumours) is fueled by Cancer Stem cells (CSCs) that take advantage of self-renewing programs that Stem cells (SCs) use during normal tissue development and repair to maintain tumour growth and in many cases drive metastasis (Lathia et al. 2015; Azzarelli et al. 2018; Rossi et al. 2020; Mitchell et al. 2021). It is therefore of paramount importance to understand what genetic insults could be imposed on normal stem cells to make them go rogue and initiate tumorigenesis and, subsequently, what genetic programs will these insults affect in order for the pre-cancerous cells to progress to malignancy.
Drosophila larval neural stem cells [NSCs; also known as Neuroblasts (NBs)] generate most cells of the Drosophila Central Nervous System (CNS) and have emerged over the past two decades as a simple yet excellent system to study asymmetric cell divisions (ACD) and tumorigenesis. Neuroblasts are born early in embryogenesis and are mitotically active over the entire juvenile life of the animal, which spans several days, depending on growth temperature. During this time, they first generate all neurons and glia of the larval central nervous system, which they subsequently enrich with thousands more neurons/glia to generate the far more complex adult CNS (Lee, 2017). Drosophila neuroblasts perform exclusively asymmetric cell divisions, during which they self-renew and generate a more differentiated precursor cell. Depending on the precursor progeny type, they are classified into different categories. Most neuroblasts, referred to as Type I, generate ganglion mother cells (GMCs), which divide only once to produce immature postmitotic neurons or, sometimes, glia. A small number of Type II neuroblasts in the larval central brain give rise to intermediate neural precursors (INPs), which behave similarly to Type I neuroblasts , and divide several times to produce GMCs. Some neuroblasts in the late embryo divide to produce postmitotic neurons directly; these are characterized as Type 0 (Homem et al. 2015; Sousa-Nunes et al. 2010; Mira and Morante, 2020).
Upon each neuroblast asymmetric cell division, an intricate machinery of cytocortical and spindle-associated proteins ensures the inheritance of pro-differentiation factors to the smaller progeny cell. The pro-differentiation factors primarily consist of the transcription factor Prospero (Pros), the translational repressor Brain-tumour (Brat) and Numb, an inhibitor of Notch signaling, a widely used paracrine signaling pathway. Together, these factors help switch off the stem-cell program in the ganglion mother cell or intermediate neural progenitor (Rhyu et al. 1994; Hirata et al. 1995; Knoblich et al. 1995; Ikeshima-Kataoka et al. 1997; Bello et al. 2006; Betschinger et al. 2006; Choksi et al. 2006; Lee et al. 2006). Genetic loss of these factors or perturbations of key asymmetric cell division molecules leading to their aberrant segregation during neural stem cell division can result in hyperplasias, reminiscent of early stages of tumorigenesis (Knoblich, 2008; Hakes and Brand, 2019). These neural stem cell hyperplasias can sometimes develop into malignancies in the adult (Jüschke et al. 2013; Narbonne-Reveau et al. 2016), although in most cases these genetic manipulations result in premature death (before metamorphosis) due to severe neurological defects. Researchers have devised a way to overcome this obstacle by allografting larval hyperplasias into the abdomens of healthy adult fly-hosts: if the allografts overproliferate, populate the abdomen, invade distal tissues (e.g. eye) and prematurely kill the host, they are classified as malignant (Caussinus and Gonzalez, 2005; Rossi and Gonzalez, 2015).
Using this allograft approach, a number of studies have shown that larval neuroblasts are rather prone to malignancy, as a variety of genetic insults can result in unrestrained growth. For example, loss of brat ( Caussinus and Gonzalez, 2005; Betschinger et al. 2006; Bowman et al. 2008) or knockdown of the Brahma complex (a Swi/Snf nucleosome remodeler) ( Neumüller et al. 2011; Eroglu et al. 2014; Koe et al. 2014), convert type II neuroblasts to malignancy. Similarly, loss of pros (Caussinus and Gonzalez, 2005; Choksi et al. 2006; Narbonne-Reveau et al. 2016) or concomitant knockdown of brat and numb result in malignant transformation of type I neuroblasts (Abdusselamoglu et al. 2019). These transformations most likely arise from the inability of intermediate neural progenitors or ganglion mother cells to commit to their differentiation routes. Other genetic insults, like loss of nerfin1 (Froldi et al. 2015) or lola (Southall et al. 2014), two Zn-finger transcription factors, seem to act not on the progenitors (INPs/GMCs), but on their post-mitotic neuron progeny. These immature cells are still prone to reverting to a neural stem cell-like proliferative state, which can progress to malignancy upon allografting. We have recently shown that overactivation of Notch signaling causes malignant neuroblast hyperplasias (Magadi et al. 2020), and that these can arise both from undifferentiation of GMCs/INPs and from dedifferentiation of immature neurons (Zacharioudaki et al. 2019).
We have started unravelling the mechanism underlying this malignant transformation. Normally, only the neural stem cell receives a high Notch signal, whereas its progeny are at a low-Notch state. Artificial upregulation of the Notch signal throughout the lineage of a neural stem cell converts many of the progeny to a neuroblast-like fate ( Wang et al. 2006; Bowman et al. 2008; Weng et al. 2010; Zacharioudaki et al. 2012) via the activation of a network of stemness-promoting transcription factors and upsetting of their temporal programme (Zacharioudaki et al. 2016). Prominent among the Notch-target transcription factors are the E(spl) and dpn genes, which encode Hes proteins. Hes proteins are very important for normal development of neural stem cells in both Drosophila and vertebrates. Indeed, triple loss of Hes1, Hes3 and Hes5 genes in the mouse brain results in premature neural stem cell differentiation (Hatakeyama et al. 2004) and similarly loss of all 7 E(spl) genes and dpn leads to premature NB differentiation in the fly (Zacharioudaki et al. 2012; Zhu et al. 2012). Overexpression of a single E(spl) gene generates a mild hyperplasia, mainly in Type II lineages (Zacharioudaki et al. 2012; Zacharioudaki et al. 2016), but combinations of overexpressed E(spl) proteins or E(spl) and Dpn lead to more severe hyperplasias that extend to both Type I and Type II lineages, partly mimicking Notch overactivation. This happens because Hes proteins repress a network of early pro-differentiation factors such as erm, nerfin1, pros, zfh1 and gcm, thus shutting down the path to differentiation in the neural stem cell progeny. We recently characterized these gene regulatory changes at the larval stage, a few days after imposing the Notch/Hes overactivation (Magadi et al. 2020). But how do these differentiation-defective cells progress to malignancy in the approximately 10 days following transplantation to an adult host? Our present work provides answers to this question, centering on the role of Hes genes in tumour progression. First, we show that E(spl) genes are needed for the rapid growth of Notch-overactive neural stem cell tumours upon allografting. In addition, we report on the transcriptome of allografted neural stem cell tumours caused by overexpression of two Hes genes. These findings have provided us with important insights into the gene regulatory changes that accompany the transformation of aberrant neural stem cells into malignant tumour cells after transplantation.
Results
Hes genes are highly expressed in Notch induced malignant neural stem cell tumours
We have previously shown that Notch hyperactivation in larval brain lineages generates neuroblast hyperplasias that become malignant upon transplantation into healthy hosts (Magadi et al. 2020). Since Hes genes, dpn and the seven E(spl) paralogues are targets of Notch in many different contexts, we set out to explore their expression in Notch allograft tumours. We either clonally overexpressed NΔecd, a constitutively active form of Notch, in larval neural stem cell lineages using the actin FLP-out (act-F/O) system (see Materials and Methods) or overexpressed NΔecd in most neural stem cell lineages using the neuroblast-specific grhNBGal4 driver. Subsequently, we transplanted the hyperplastic brain lobes into the abdomen of healthy adult fly hosts. We explored the expression patterns of dpn and one of the genes from the E(spl) locus E(spl)mγ, which, among the seven paralogues, is the one with the highest levels of expression in normal neuroblasts. We confirmed that primary tumours in the larval central nervous system induce both Dpn and E(spl)mγGFP expression (Fig. S1). After the tumours were allowed to grow in the abdomen of host flies, and before the host's demise, we removed the allografts and re-transplanted them into healthy flies. We repeated this process several times (up to 3 re-transplantations, T0 being the first one and T3 the fourth one, see Fig. 1A). We observed that both E(spl)mγGFP and Dpn are highly expressed in most cells of allograft Notch tumours (T0; Fig. 1 B,C) and that Dpn expression levels remain high upon serial allografting (Fig. 1B). Transcriptome analysis of primary tumours (larval brains overexpressing NΔecd) as well as T0 allografts confirmed the high expression of dpn and three of the E(spl) genes, mγ, mβ and m8; the remaining 4 E(spl) genes were expressed at moderate to undetectable levels [(Magadi et al. 2020) and Voutyraki, Zacharioudaki et al, manuscript in preparation].
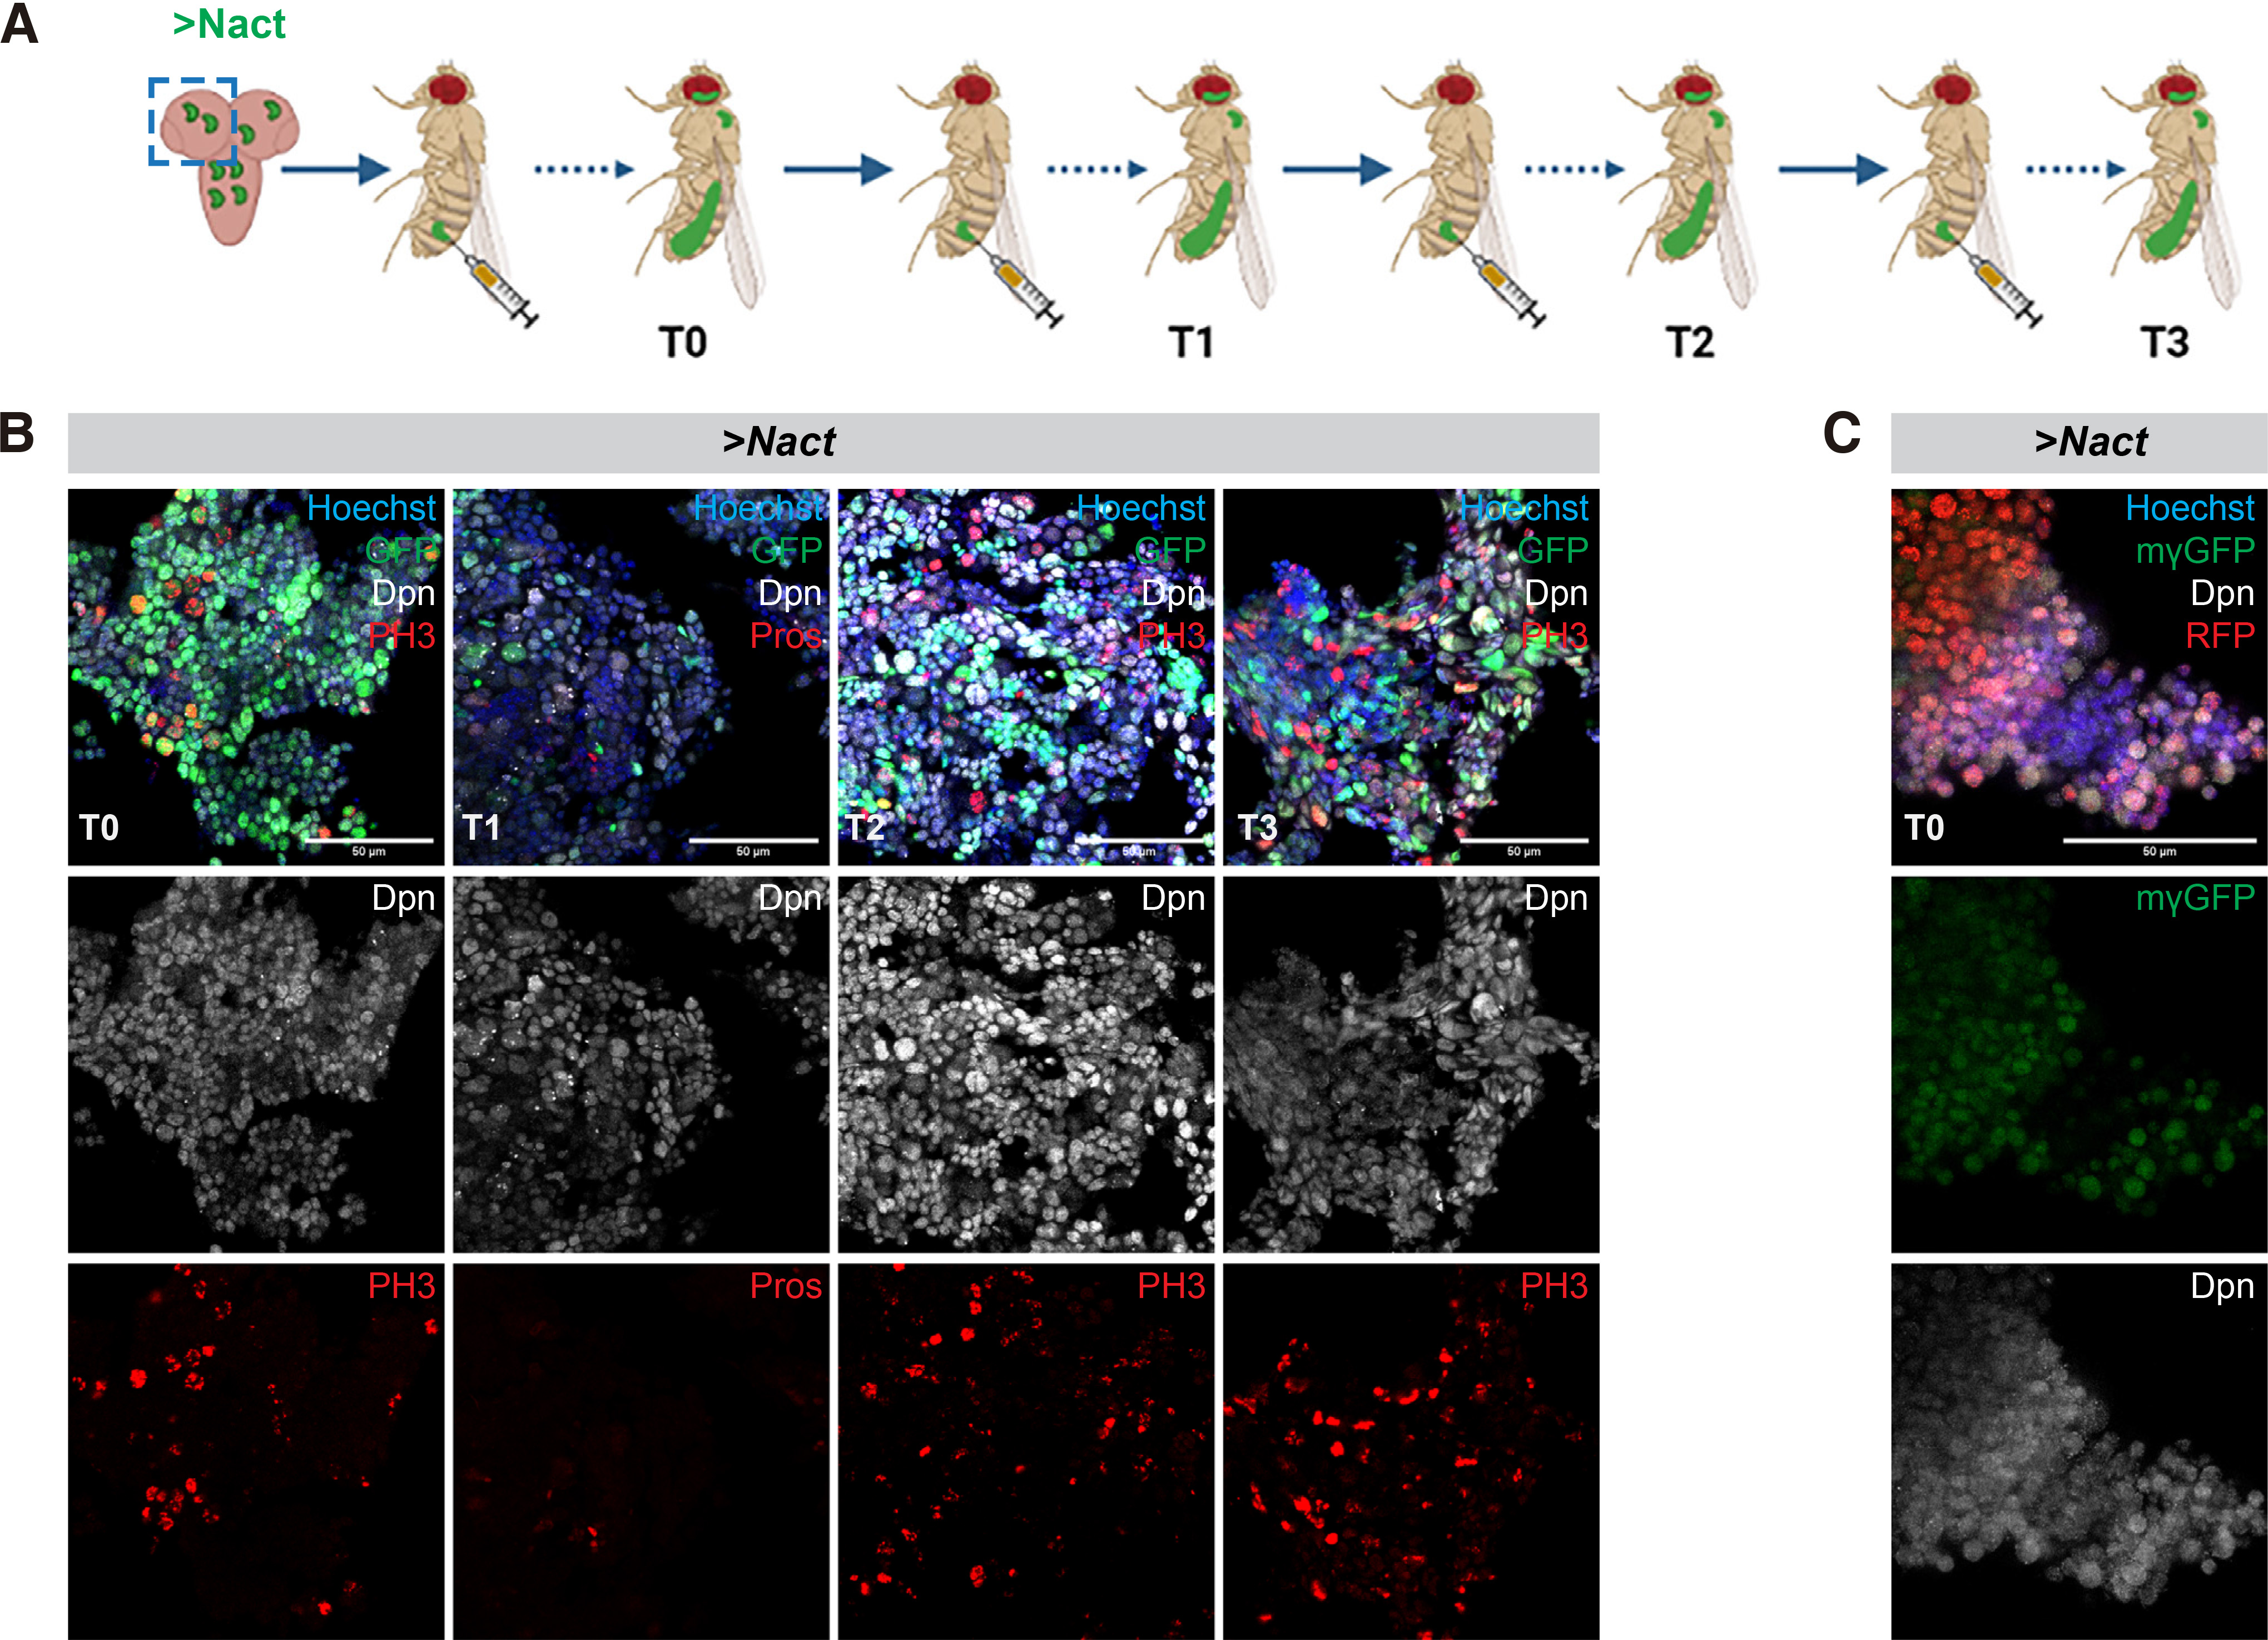
Fig. 1. Hes genes are expressed in Notch-induced allograft tumours.
(A) Schematic representation of the transplantation assay. Larval brain lobes containing actin>F/O clones overexpressing GFP and a constitutively active form of Notch (ΝΔecd, aka Nact) were allografted into the abdomen of adult healthy w1118 females (3-4 days after pupal eclosion) (allograft T0). After the tumour had grown for several days, it was dissected out and re-transplanted into new hosts (allograft T1). This process was repeated several times (up to allograft T3). (B) Confocal images of act-F/O>NΔecd+GFP allograft tumour fragments recovered from the abdomen of host flies from serial rounds of transplantation and stained for Dpn (grey) and the mitotic marker Histone H3-phosphoS10 (PH3, red) or the neuronal marker Pros (red). Hoechst (blue) shows nuclei. (C) Confocal images of NΔecd allograft tumour fragments generated with the aTub-G80ts, grhGal4>UAS-REDStinger system and kept at 30°C. Dpn (grey) and E(spl)mγGFP(green) both stain neural stem cell-like cells. Hoechst (blue) shows nuclei. Scale bar 50μm.
Hes genes are necessary for Notch induced malignancy
The Notch-induced primary hyperplasias in the larval brain are dependent on the integrity of the E(spl) locus (Zacharioudaki et al. 2012; Zacharioudaki et al. 2016). We asked whether the more advanced NΔecd allograft tumours are also dependent on E(spl) genes. We used the act-F/O system to induce NΔecd in the background of a homozygous deficiency, E(spl)Δmγ-mβDK33-10.1 that removes two E(spl) genes, E(spl)mβ and E(spl)mγ (Babaoǧlan et al. 2013). We first examined the effects in hyperplastic larval central nervous systems. Indeed, there was a mild reduction in hyperplastic Type I lineages. (Fig. S2), a more moderate suppression of hyperplasia than when we removed the entire E(spl) locus (Fig. S3). We subsequently transplanted brain lobes with GFP-expressing Notch hyperplasias in wt or E(spl)Δmγ-mβDK33-10.1 background and monitored the mesoscopic appearance of GFP signal in host flies, as well as the time of their death upon allografting. Although there was a delay in GFP signal detection (Fig. 2A), indicating a reduced tumour burden, there was no significant change in their overall survival rate (Fig. 2B), meaning that both tumorigenic backgrounds are equally detrimental to the tumour bearing hosts. Upon immunohistological inspection of tumour explants, we observed an increase in neuronal differentiation markers (such as Pros, Fig. 2C) but no change in mitotic index (PH3, Fig. 2D).
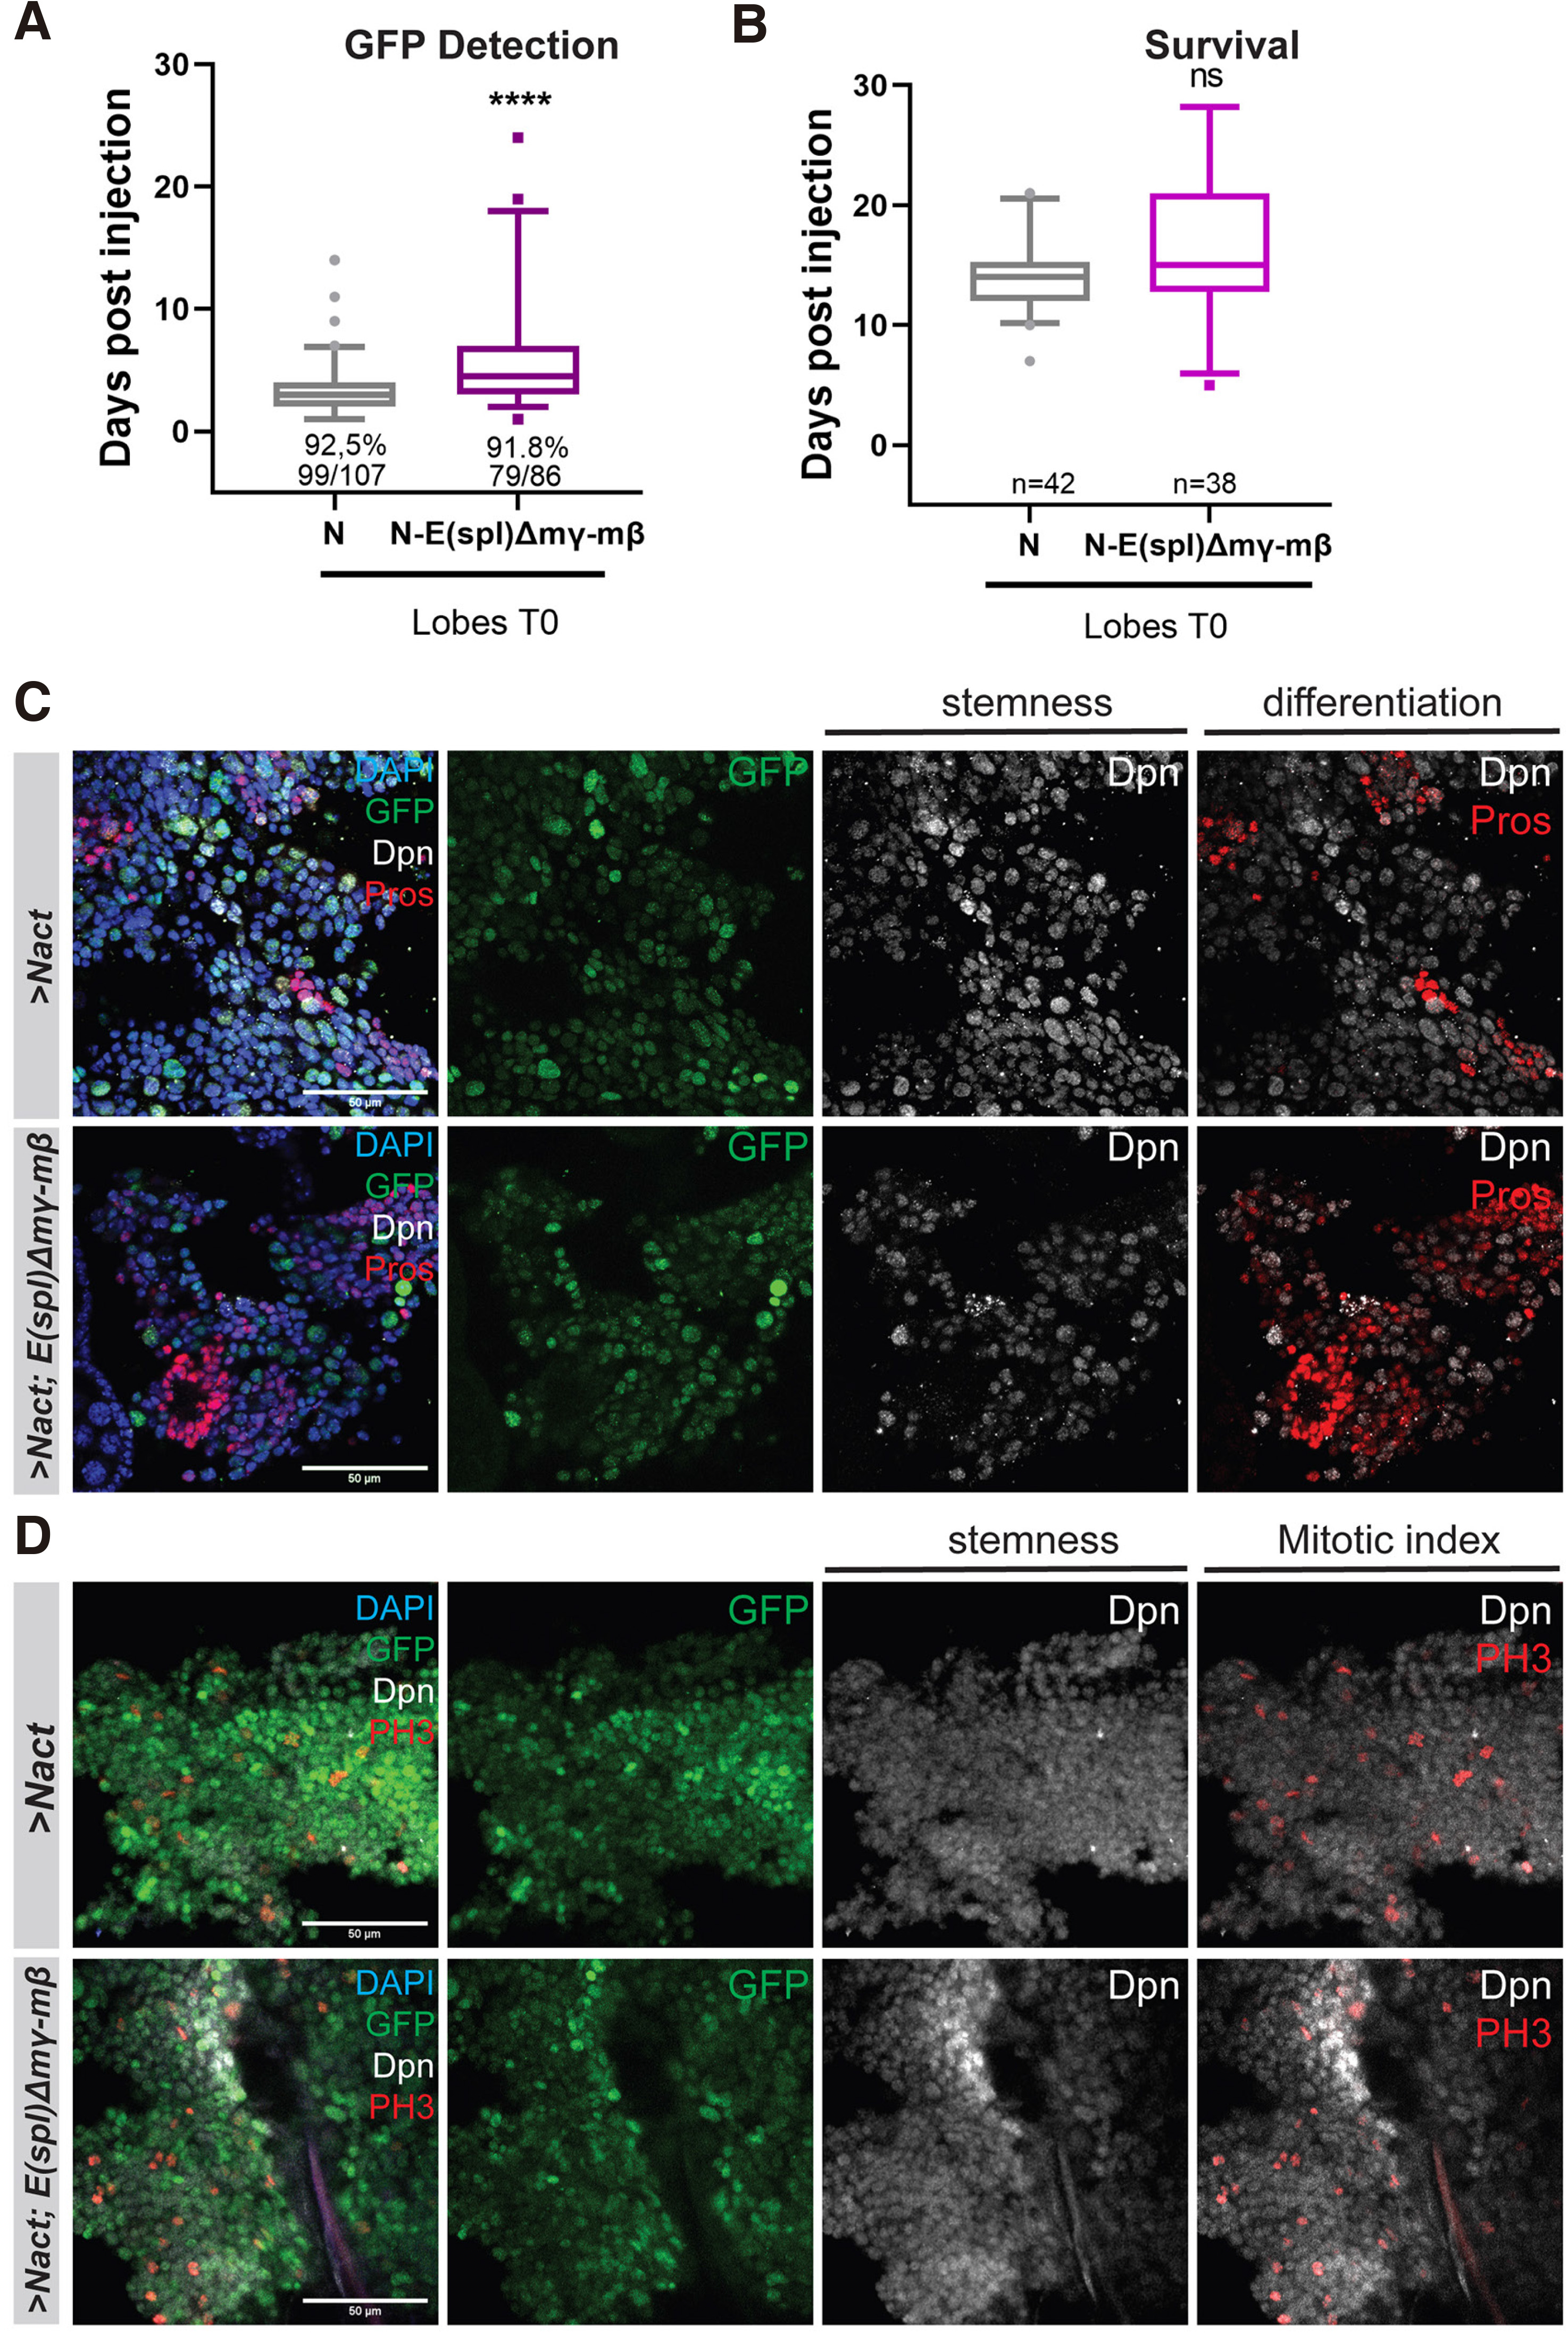
Fig. 2. Loss of E(spl)mγ and E(spl)mβ mildly affects the Notch-induced allograft tumour growth.
(A) Box plot diagram that shows the earliest time of detection of GFP under an epifluorescent stereoscope after transplantation of lobes of carrying actin-F/O clones of the indicated genotypes (NΔecd overexpression in wt vs E(spl)Δmγ-mβ) background) into host flies [median values (middle bars) and first to third interquartile ranges (boxes); whiskers are 5% and 95%; dots indicate outliers]. ****P<0.0001 (unpaired t-test). The percentages indicate the proportion of flies developing GFP from the total number of flies injected with the actual numbers of GFP expressing flies over injected flies shown below. (B) Box plot diagram that shows the host lifespan after transplantation [box-plot: median values (middle bars) and first to third interquartile ranges (boxes); whiskers are 5% and 95%; dots indicate outliers]. ns=not statistically significant change. The numbers indicate the number of GFP tumour bearing host flies monitored for their survival after injection. (C-D) shows fragments of N vs N- E(spl)Δmγ,mβ) tumours recovered from allografted host abdomens 8-10 days after transplantation and stained for the markers shown. Dpn (grey) stains neuroblast-like cells, Pros (red) is a neuronal marker and Histone H3-phosphoS10 (PH3, red) is a mitotic marker, DAPI (blue) shows nuclei. Scale bars: 50 μm.
In addition to E(spl)mγ and mβ, E(spl)m8 is also quite strongly expressed in larval neuroblasts, and its presence may explain the mild effect seen with E(spl)Δmγ-mβDK33-10.1. We therefore generated clones in the larval central nervous system that overexpress NΔecd and lack all 7 genes of the E(spl) locus. Unlike E(spl)Δmγ-mβDK33-10.1, which is homozygous viable, Df(3R)b32.2, a deletion of the entire E(spl) locus, is embryonic lethal, so we made use of the MARCM system to generate homozygous mutant clones in a heterozygous background. This system generates fewer clones compared with the act-F/O system, thus the tumour growth rate upon transplantation is slower and overall host survival is longer. More specifically, GFP signal is detectable in the hosts’ abdomens at about 11 days post injection vs approximately 4 days for act-F/O> NΔecd clones (Fig. 2A, 3A) and hosts bearing NΔecd tumours with the MARCM system die at ~20 days instead of ~14; Fig. 2B, 3C) Removal of the E(spl) locus led to a suppression of primary NΔecd hyperplasias (Fig. S3) and a remarkable delay in the hosts’ death after transplantation (around 30d) compared to control ΝΔecd tumours (Fig. 3 A,C,E). The earliest time of GFP detection was also delayed, although the effect was less pronounced upon brain transplantations versus VNC transplantation (Fig. 3 B,D). Immunohistological examination of these allograft tumours revealed that loss of E(spl) leads to NΔecd tumours that have increased number of cells with neuronal differentiation markers (Pros-positive cells; Fig. 3F), as well as a decrease in the number of cells undergoing mitosis (PH3-positive cells; Fig. 3G). It is also noteworthy that a high number of transplanted flies did not develop tumours at all (Fig. 3 A,B) and, those that did, did not display extensive spread of the GFP tissue away from the abdomen upon mesoscopic observation (Fig. 3E). Overall, it appears that compromising E(spl) activity does not abolish NΔecd-induced tumorigenesis, but slows down the progression and malignancy of the resulting tumours.
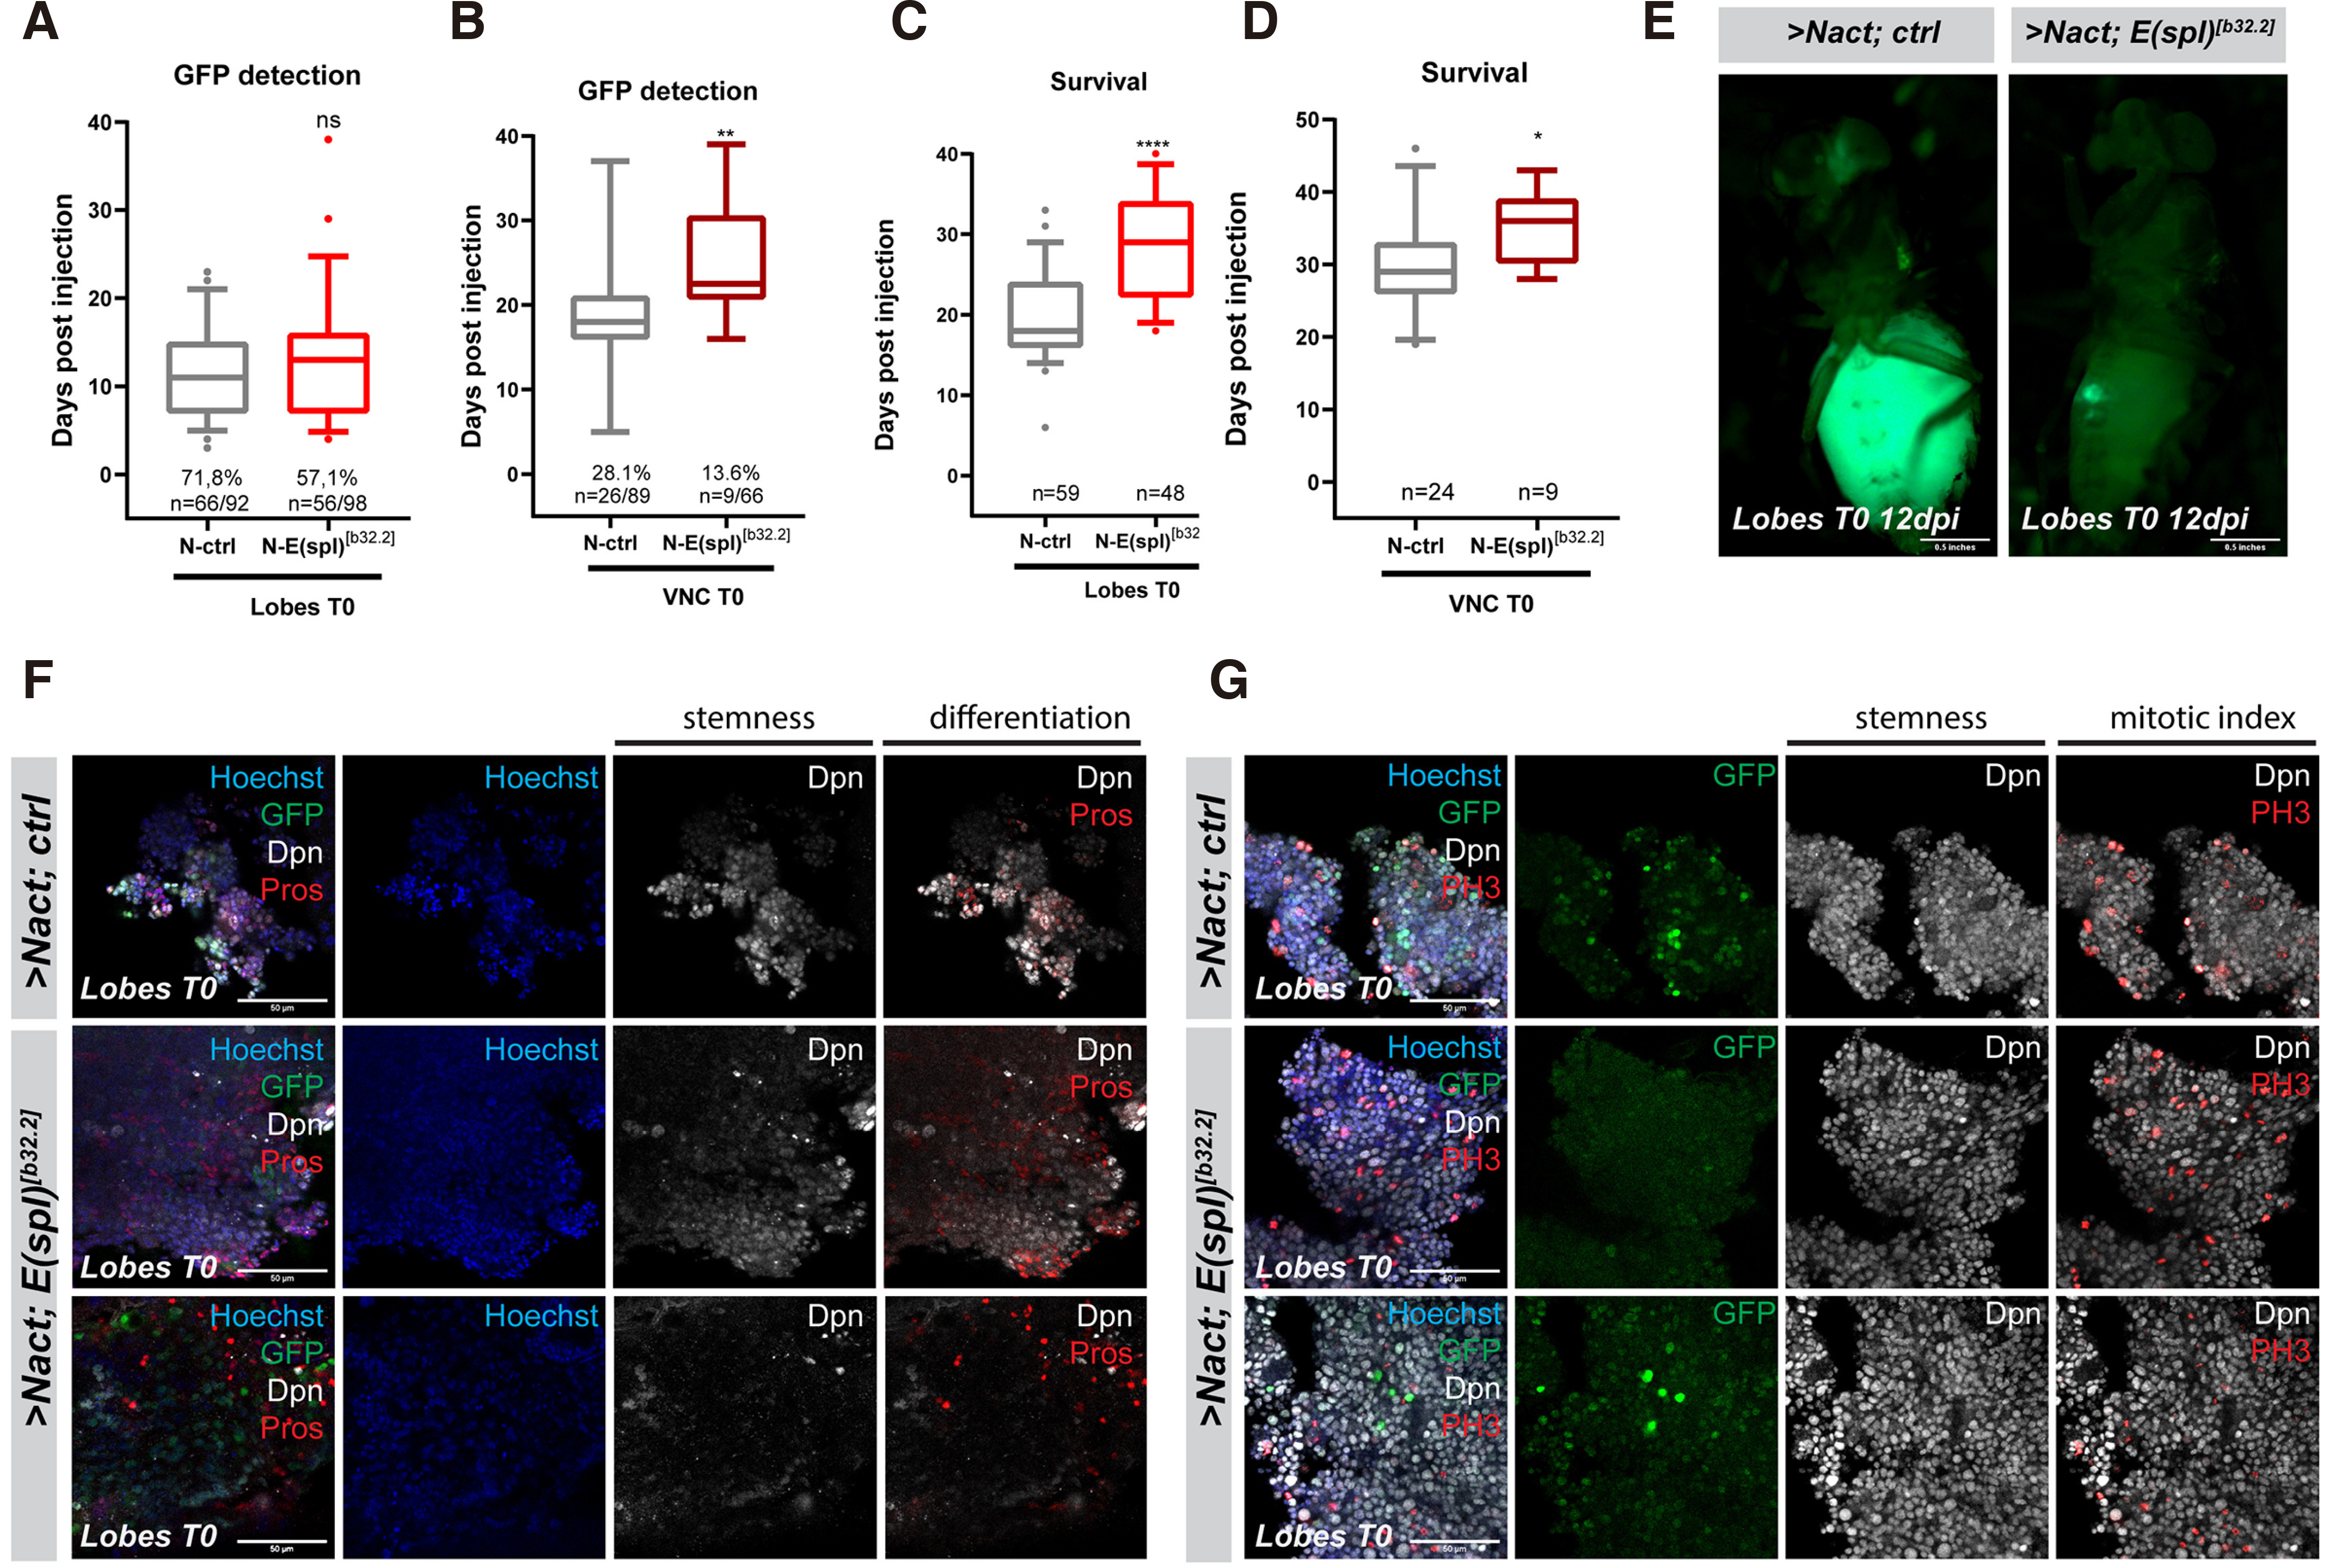
Fig. 3. Loss of the entire E(spl) locus significantly delays Notch-induced allograft tumour growth.
(A-B) Box plot diagram that shows the earliest time of detection of GFP under an epifluorescent stereoscope after transplantation of lobes (A) or ventral nerve cords (VNCs) (B) carrying MARCM clones of the indicated genotypes [NΔecd in wt (ctrl) background vs a background where the whole E(spl) locus is deleted (E(spl)b32.2)] into host flies. The percentages indicate the proportion of flies developing GFP from the total number of flies injected with the actual numbers of GFP expressing flies over injected flies shown below. (C-D) Box plot diagram that shows the host lifespan after transplantation of lobes or VNCs of the indicated genotypes. The numbers indicate the sample size of GFP tumour bearing host flies monitored for their survival after injection. [For Box plots in A-D: median values (middle bars) and first to third interquartile ranges (boxes); whiskers are 5% and 95%; dots indicate outliers. * P < 0.05, ** P < 0.01, ****P<0.0001 (unpaired t-test), ns=not statistically significant change]. (E) Epifluorescent images of representative fly hosts 12 days after injection with a MARCM NΔecd brain lobe and a MARCM NΔecd brain lobe in the E(spl)b32.2 background. Note that in the latter, the allograft tumour grows slowly near the site of the injection and does not spread to distal sites (e.g. the eye) as in the former. (F-G) Fragments of NΔecd vs NΔecd- E(spl)b32.2 tumours recovered from allografted host abdomens and stained for various markers. Dpn (grey) stains neuroblast-like cells, Pros (red) is a neuronal marker and Histone H3-phosphoS10 (PH3, red) is a mitotic marker, Hoechst (blue) shows nuclei. Scale bars: 50 μm.
Overexpression of Hes genes causes malignant neural stem cell tumours
Like overactivation of Notch, overexpression of two Hes genes (dpn and E(spl)mγ, henceforth called DM) by act-F/O in larval NB lineages causes tumours upon transplantation into the abdomen of young healthy female flies (Magadi et al. 2020). DM tumours exhibit spreading from the transplantation site to distal regions throughout the body cavity and reduce the host's lifespan, somewhat less dramatically than NΔecd tumours. We performed serial passaging of these DM tumours up to the T3 stage, as described above (Fig. 4A). Histological examination of T0 and T3 DM allografts 10-12 days post transplantation revealed that the majority of the cells were proliferative (Fig. 4C) and bore stem cell characteristics (Fig. 4 B,C). Besides the Dpn protein, another stem cell marker, Asense (Ase), was detected in a subset of the tumour cells (Fig. S4B). The tumours also contained a small number of cells bearing neuronal differentiation markers (Pros-positive, Fig. 4A; Elav-positive, Fig. S4A) but not glial characteristics (Repo-positive cells, Fig. S4B). The incidence of Pros or Elav-positive cells was somewhat higher in DM tumours than in NΔecd tumours (Figs. 1-3, Fig. S4 A vs C). Thus, persistent expression of DM is sufficient to induce malignant transformation of larval brain neural stem cell lineages and maintain this potential after serial allografts. These tumours retain neural stem cell properties with high proliferative capacity and exhibit little differentiation.
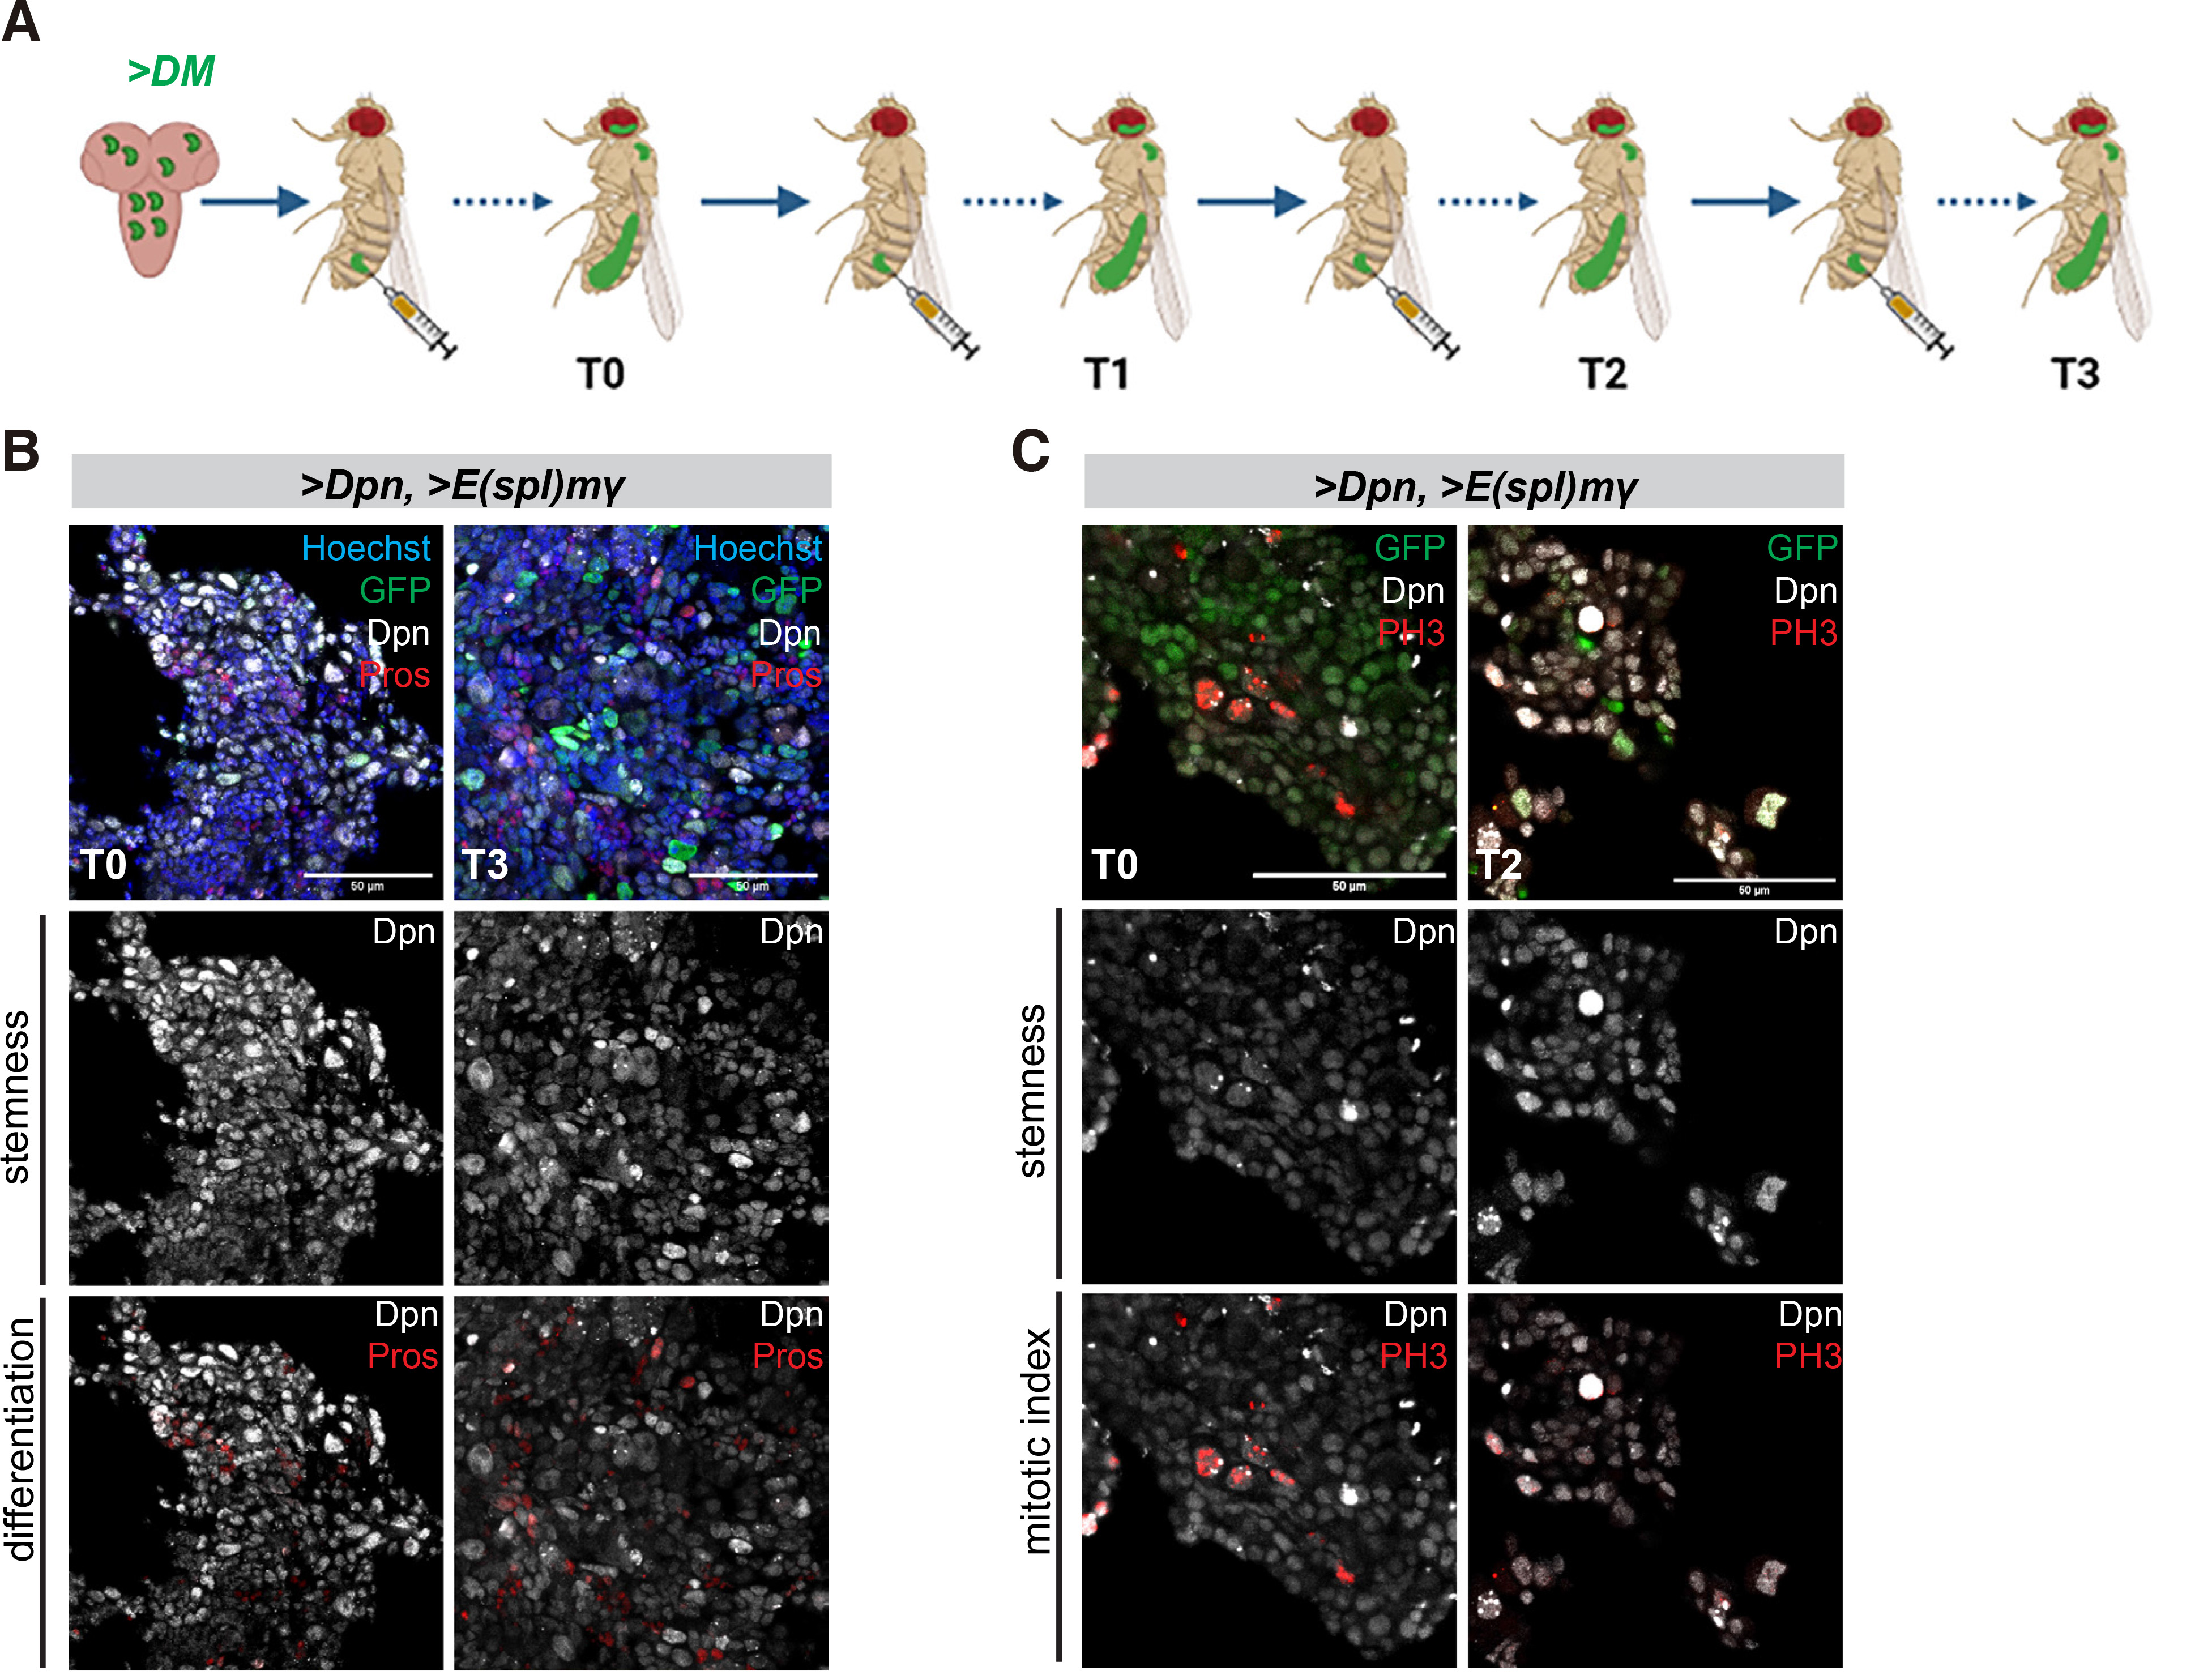
Fig. 4. Overexpression of Hes genes causes malignant neural stem cell tumours with little differentiation.
(A) Schematic representation of the transplantation assay. Larval brain lobes containing acti-F/O clones overexpressing GFP and a combination of two Hes genes, dpn and E(spl)mγ (collectively called DM) were allografted into the abdomen of adult healthy w1118 females (3-4 days after pupal eclosion) (allograft T0). After the tumour had grown for several days, it was dissected out and re-transplanted into new hosts (allograft T1). This process was repeated several times up to allograft T3. (B-C) Confocal images of DM allograft tumour fragments recovered from the abdomen of host flies from serial rounds of transplantation and stained for Dpn (grey) and the early neuronal marker Pros (red) or the mitotic marker Histone H3-phosphoS10 (PH3, red). Hoechst (blue) shows nuclei. Scale bar 50μm.
Transcriptomic analysis in serial allograft tumours upon overexpression of Hes
Since Hes overexpression induces a malignant transformation of neural stem cell lineages, we asked how the transcriptomes of these malignant tumours change over time upon serial allografting. We therefore performed expression profiling of isolated NSC-like cells from DM-overexpressing larval brains and their first (T0) and fourth (T3) allografts. We used the act-F/O system to induce DM-overexpressing GFP-marked clones in the larval central nervous system, and transplanted these hyperplastic brain lobes to adult hosts up to the T3 stage (Fig. 4A). As a control, we hand-dissected and dissociated act-F/O>DM larval brains in order to isolate GFP-positive cells by FACS sorting (Fig. S5). RNA was isolated from FACS-sorted larval brain cells and from bulk tumours at the T0 and T3 stages. Differentially expressed gene (DEG) analysis revealed 4,164 DEGs in T0 vs. FACS, 2,042 upregulated and 2,122 downregulated (Fig. 5A). Likewise, at the T3 stage we found 4,316 DEGs, 2,087 upregulated and 2,229 downregulated compared to the FACS control (Fig. 5B). This demonstrated that the transcriptional profile of allograft tumours differed vastly from the primary brain hyperplasia. However, the comparison of T3 vs. T0 allograft stage did not reveal major changes in gene expression (Fig. 5C). Only 11 genes changed at FDR≤ 0.05, suggesting that the DM allograft tumour transcriptome remains relatively invariable over time. Consistently, the differentially expressed genes at the T0 or T3 stage compared with the primary tumour (FACS) showed a great degree of overlap (Fig. 5G).
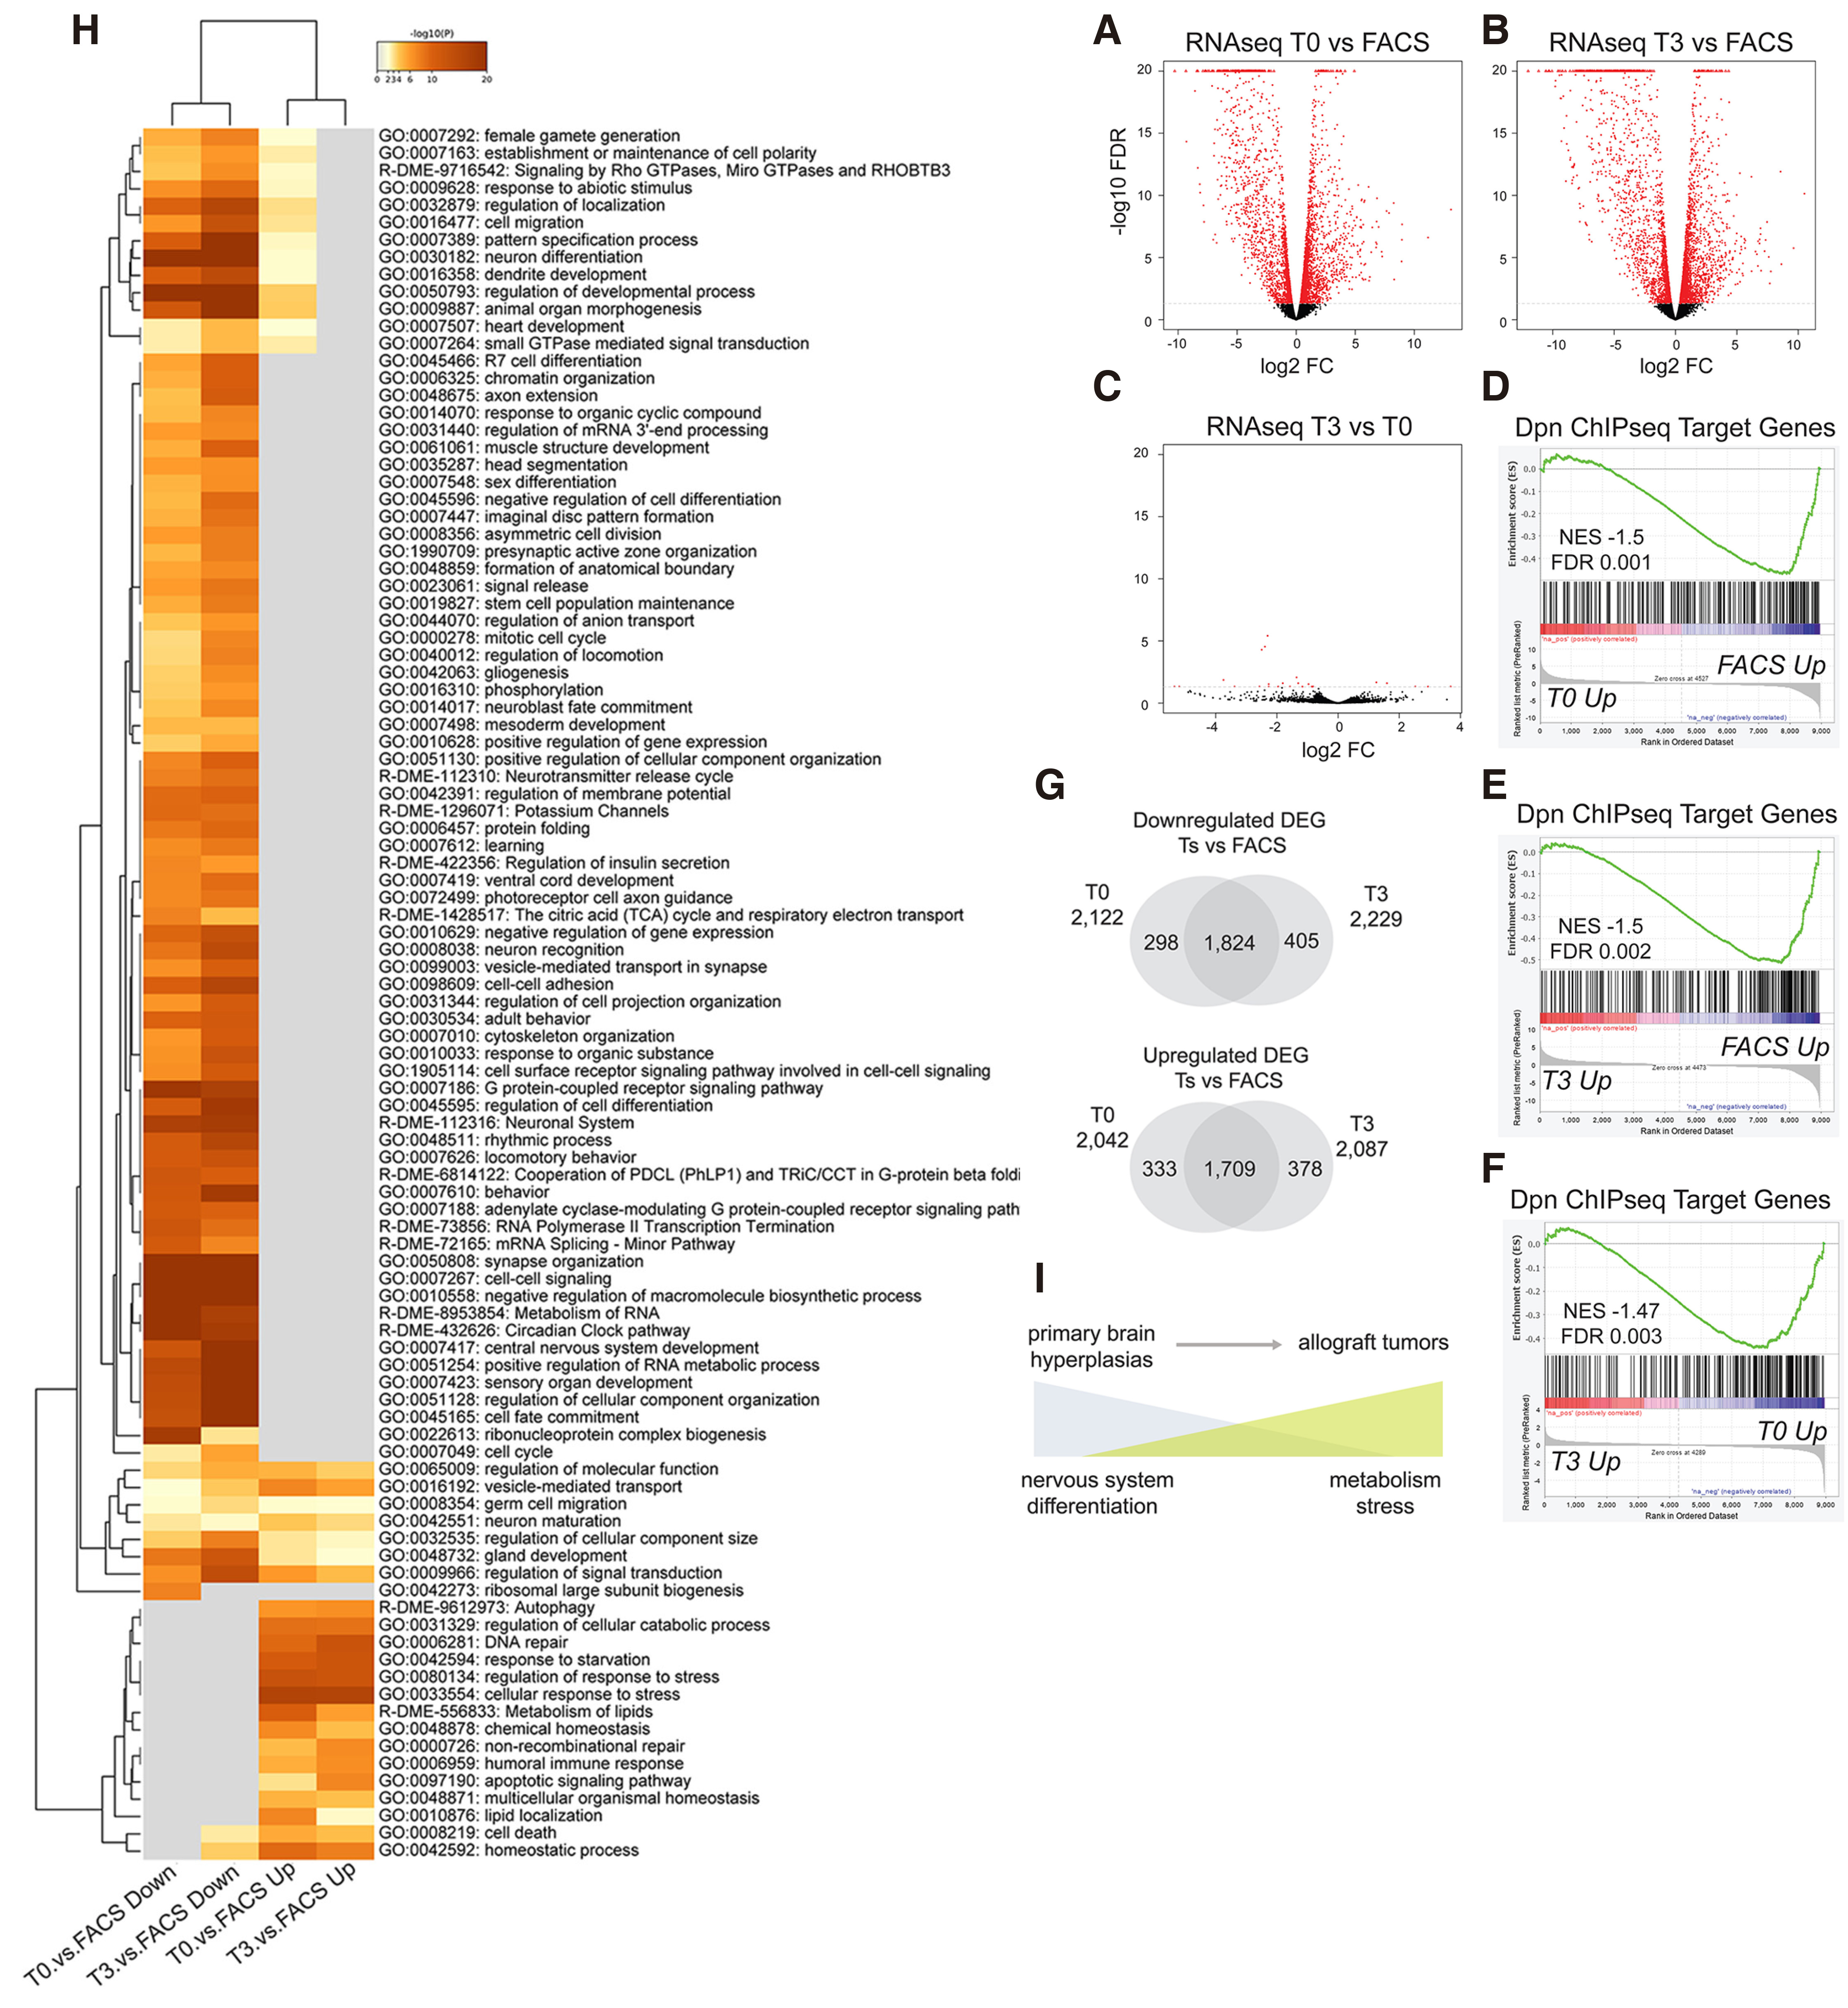
Fig. 5. Transcriptome analysis of primary vs allografted DM tumour material.
(A-C) Volcano plots of all expressed genes from RNA-seq. Differentially expressed genes with FDR< 0.05 are marked in red. (A) T0 versus FACS sorted primary cells. (B) T3 versus FACS sorted primary cells. (C) T3 versus T0 allograft tumours. (D-F) Gene set enrichment analysis (GSEA) of ranked RNAseq gene sets with Dpn Chip-seq target genes (Magadi et al, 2020). (D) GSEA of T0 vs. FACS ranked genes. (E) GSEA of T3 vs. FACS ranked genes. (F) GSEA of T3 vs. T0 ranked genes. (G) Venn diagrams of downregulated (top) and upregulated (bottom) differentially expressed genes, FDR 0.05, between T0 vs. FACS and T3 vs. FACS comparisons. (H) Heatmap of enriched GO-terms of T0 and T3 vs FACS Upregulated and Downregulated genes based on the p-value from metascape analysis. (I) Cartoon presenting a summary of progression from primary brain hyperplasia to allograft tumours.
Neural differentiation promoting transcription factors continue to be downregulated in Hes allograft tumours
We investigated the correlation of our differentially expressed genes with the Dpn ChIP-seq target genes, mapped from DM expressing primary brain lobes (Magadi et al. 2020). Gene set enrichment analysis (GSEA) showed significant correlation of Dpn binding with downregulated genes in both the T0 vs. FACS (Fig. 5D) and the T3 vs. FACS (Fig. 5E) ranked gene sets, in line with Dpn’s function as a transcriptional repressor. Interestingly, despite the lack of major transcriptional changes in the RNA-seq of T3 vs. T0 tumours (Fig. 5C) the GSEA analysis reveals a trend of Dpn target genes to continue dropping in expression as the tumour progresses (Fig. 5F).
In agreement with our earlier conclusion that neural differentiation genes are foremost targets of Hes proteins, gene ontology (GO) term analysis of the DM allografts vs FACS downregulated genes revealed enrichment for processes related to neuronal differentiation (Fig. 5H). This downregulation of neuronal genes is in part due to the presence of unaffected neurons in the FACS sample. As we reported earlier (Magadi et al. 2020), actin-F/O>DM in mature neurons does not reprogram them to a stem cell fate, nor does it restart mitoses. As our GFP-based FACS protocol could not discern mature neurons from progenitor cells that were affected by DM expression, our control FACS transcriptome contains the entire complement of neuronally expressed genes, such as those related to synaptic neurotransmission. Their elimination in the T0 & T3 samples confirms the fact that mature neurons do not survive in the transplanted tumours; instead, the tumour initiating cells come from the progenitor pool of the act-F/O>DM larval brains. Besides downregulation of differentiated neuronal functions, we observed downregulation of early differentiation-promoting transcription factors, such as pros, erm and nerfin-1. As these are primarily expressed in immature neurons, we believe that their continued repression in the allograft tumours is most likely a direct effect of DM expression. Indeed, all these genes are located in the vicinity of Dpn binding events.
Stress response and metabolic reprogramming associated with allograft tumour growth
Whereas GO analysis of the T0 and T3 downregulated genes was dominated by neuronal differentiation terms, upregulated genes were enriched in functions related to stress and metabolism. Various types of stress were evident. The upregulation of DNA repair enzymes (e.g. GO:0006281) indicates possible DNA replication stress due to rapid proliferation and/or genotoxic stress due to transposon mobilization. Indeed, transposons seem to be overactivated upon progression from primary to T0/T3 tumours, as evidenced by upregulation of the piRNA pathway (GO:0010528). Additionally, nutrient stress (e.g. GO:0042594 "response to starvation") and oxidative stress (e.g. GO:0006979 "response to oxidative stress", GO:0006749 "glutathione metabolic process") were evident. Several metabolic terms were enriched in the upregulated genes. These were mostly related to lipid homeostasis and catabolism, e.g. fatty acid oxidation (GO:0019395). Although oxidative phosphorylation (OxPhos) was apparently suppressed (e.g. dme00190 "oxidative phosphorylation" enriched in the downregulated genes), terms related to glycolysis were not detected in the upregulated genes, suggesting that the DM tumour does not undergo a switch to aerobic glycolysis (the Warburg effect). A cohort of glycolytic genes upregulated in a different central nervous system tumour, caused by the loss of brat gene (Bonnay et al. 2020) were either unaffected (Hex-A, Pfk, Ald) or downregulated (Ldh) in the DM tumours. Other enriched metabolic terms among the upregulated genes had to do with nucleotide biosynthesis (R-DME-15869), amino acid biosynthesis (GO:1901607) and breakdown (R-DME-70895) and general control of cell size (GO:0045793). The master transcriptional regulators of cell growth [Myc; (Gallant, 2013)] and nutrient utilization [Mondo and SREBP; (Havula and Hietakangas, 2018)] were all upregulated upon malignant progression. The entire list of GO-terms enriched in the differentially expressed genes from T0 and T3 tumours is shown in Table S4.
Discussion
In the multitude of cellular contexts where Notch signaling occurs across the animal kingdom, Hes genes are among the most common upregulated targets. In the Drosophila larval central nervous system, where thousands of new neurons and glia are being born to build the adult nervous system, the highly proliferative neural stem cells receive a Delta-Notch signal from their immediate progeny, ganglion mother cells or intermediate neural progenitors. As a result, they turn on the Hes genes dpn, E(spl)mγ, mβ and m8 and a few hundred of other non-Hes targets (San-Juán and Baonza, 2011; Zacharioudaki et al. 2012; Zacharioudaki et al. 2016; Magadi et al. 2020;). Expressing a constitutively active Notch, NΔecd, in neural stem cell progeny, like immature neurons (normally Notch-low cells), causes their conversion to a stem-cell-like fate with ensuing hyperplasia. These hyperplasias are dependent on Hes expression, with dpn and E(spl) both contributing to this aberrant transformation (Zacharioudaki et al. 2012). Within days of allografting pieces from NΔecd hyperplastic CNSs into adult hosts, the larval tissue becomes neoplastic (Magadi et al. 2020) and Fig. 1). Similar to the effects that we had observed in larvae, we now show that integrity of the E(spl) locus is needed to attain the full tumorigenic potential in allografts (Figs. 2 and 3). Although NΔecd tumours grow more slowly in the absence of E(spl), they still overgrow in the host, unlike a wt CNS fragment [see Fig. 2A in (Magadi et al. 2020)]; therefore, persistent Notch activity endows them with tumorigenic potential, via turning on additional targets, including dpn. We are in the process of analyzing the transcriptomes of ΝΔecd tumours at different stages and these will be presented in an upcoming report (CV, EZ, VT & CD in preparation). Of note, the four Hes genes, dpn, E(spl)mγ, m8 and mβ, stay high in ΝΔecd tumours up to the T3 stage. It will be interesting to determine whether in the long run (e.g. by T10) NΔecd tumours would accumulate sufficient genetic alterations that would eventually render them independent of E(spl) expression.
Hes genes have undergone multiple duplications during animal evolution and various combinations have been shown to readily form heterodimers (Fischer and Gessler, 2007) which may be more effective in their activity as transcriptional repressors than the respective homodimers. Consistently, we showed earlier that aberrantly expressing Hes duos in neural stem cell progeny mimics the neural stem cell hyperplasias engendered by NΔecd, whereas single Hes factors only cause very sporadic mild transformations. The most potent heterodimeric combination we have tested is dpn + E(spl)mγ, abbreviated to DM. DM hyperplasias also become tumorigenic upon transplantation, although they grow slower than NΔecd (Magadi et al 2020). Here we analyzed the transcriptome of DM tumours, with the ultimate goal of understanding what drives and sustains tumorigenesis. We used tumours from three stages: the primary larval cells (FACS sorted from dissociated CNSs); the first allograft 10-12 days after transplantation (T0); and the fourth allograft, after three more rounds of passaging in adult hosts (T3). We observed drastic changes between the primary and allograft stages, in part due to elimination of neurons after transplantation and in part due to transcriptional reprogramming of the surviving malignant cells. On the other hand, the changes between T0 and T3 were only incremental and most fell below significance threshold.
A prominent change noted in the transition from primary tumour to T0 was the repression of early differentiation-promoting genes, many of which were shown earlier to be direct targets of Dpn by chromatin profiling (Magadi et al 2020). These had been already downregulated in the aberrant DM expressing larval precursors, and all of them were further downregulated at T0. However, they were still expressed at detectable levels, which either stayed the same in T3 or went further down. Some of these pro-differentiation genes still displayed substantial levels of expression at T3, such as pros, elav and nerfin-1, whereas others, like zfh1 and gcm, were all but eliminated. We had earlier shown that re-instating zfh1 or gcm expression in NΔecd or DM tumours makes them less aggressive at the T0 stage, both in terms of percentage of allografts that manage to grow and in terms of host survival after transplantation (Magadi et al. 2020).
Besides repression of pro-differentiation factors by the DM repressor duo, what other alterations might accompany malignancy? The transcriptome analysis gave us a few pointers, which we will summarize below.
The remaining two neural stem cell-expressed Hes genes, E(spl)mβ and m8, are downregulated in DM T0/T3 stages. This may be due to Hes cross-repression (Couturier et al. 2019). The levels of dpn and E(spl)mγ RNAs are similar between DM and ΝΔecd tumours and in the latter E(spl)mβ and m8 stay at moderate levels, perhaps because NΔecd-mediated activation counterbalances Hes-mediated repression.
Translational regulation may be altered as DM tumours progress. Two major neural RNA binding proteins, Imp and Syncrip (Yang et al. 2017), are both highly expressed in DM tumours. Imp gradually rises from primary to T3, whereas Syp drops at T0/T3, but still remains at high levels. In two different types of neural tumour, caused by knockdown of pros or the chromatin remodeler snr1, respectively, a heterogeneous population consisting of Imp-high/Syp-low and Imp-low/Syp-high cells was observed (Genovese et al. 2019). This may be the same in the DM tumours. An lncRNA interactor of Syp, cherub (Landskron et al. 2018), is the most highly expressed gene at all three DM tumour stages, but does not change as the tumour progresses. cherub inhibits Syp from enabling pros translation, which may help keep Pros protein levels low in the tumour. However, the pros mRNA isoform that is regulated by Syp seems to be neuron-specific (Samuels et al. 2020) and we detect it only in the primary tumour and not at the T0/T3 stages. It therefore appears that the Syp/cherub complex acts via other RNA targets in the tumours. A third translational regulator, brat, known to act as a tumour suppressor in neural lineages (Reichardt et al. 2018), drops gradually from DM primary to T3 stage, but remains at high levels.
Allografted DM tumours are more stressed than their primary counterparts. On the one hand, they display nutrient stress and increased autophagy, whereas on the other they upregulate Myc and grow in size. Normal neural stem cells stop increasing their size before terminally differentiating in the early pupa; this has been causally correlated with a metabolic switch to higher OxPhos (Homem et al. 2014). DM tumour cells, on the other hand, show increased cell growth and reduced OxPhos. The energy needed to fuel their growth seems to come in the form of fatty acid oxidation and lipid consumption. Oxidative stress, perhaps as a result of increased fatty acid oxidation, is also evident. Interestingly, N-Myc is upregulated in a number of human cancers, e.g. neuroblastoma and hepatic cancer, and this has been shown to correlate with increased lipid metabolism (Yoshida, 2020). An interesting synergy between tumorigenic signals and nutrient restriction has recently been described in a different Drosophila tumour model (Sorge et al. 2020), which shows parallels with but also differences from our DM tumour.
As a result of metabolic reprogramming and rapid growth, DM tumours suffer DNA stress, with many repair mechanisms showing upregulation upon allografting. Intriguingly, tumorigenesis seems to be accompanied by unleashing of transposons, evidenced by upregulation of the piRNA pathway genes. The piRNA pathway had also been detectably upregulated in a different type of fly brain tumour, caused by loss of the l(3)mbt repressor (Janic et al. 2010). DNA repair and transposon activity together suggest a high degree of genomic instability during DM tumour progression.
Materials and Methods
Fly stocks and genetics
Drosophila stocks are described in Flybase and were obtained from the Bloomington Drosophila Stock Center (BDSC) unless otherwise indicated.
Overproliferating third instar larval CNSs were obtained by crossing UAS-NΔecd flies (Fuerstenberg and Giniger, 1998) or UAS-NΔecd; E(spl)mγ-GFP (Almeida and Bray, 2005) with aTub-Gal80ts; grhNB-Gal4 or aTub-Gal80ts,UAS-RedStinger; grhNB-Gal4 (Zacharioudaki et al. 2016) Crosses were maintained at 18°C for 9 days, then shifted to 30°C for 48 h before dissection.
Flip-out clones
Stocks for act-F/O clones were generated as follows: Male flies from the hs-FLP; act-FRT>STOP>FRT-Gal4, UAS-GFP (act-F/O in brief) stock were crossed with females of the appropriate UAS combinations for generating clones: UAS-ΝΔecd (aka Nact) for Notch over-activation clones, UAS-HA-mγ, UAS-HA-dpn (Magadi et al. 2020) for DM clones and UAS-w-RNAi (BDSC 35573) for control clones. For NΔecd; E(spl)Δmγ-mβ ) clones, the deficiency E(spl)Δmγ-mβ DK33-10.1 (Babaoǧlan et al. 2013) was used. Male flies from hs-FLP; act-FRT>STOP>FRT-Gal4, UAS-GFP, E(spl)Δmγ-mβ DK33-10.1 were crossed to female flies UAS-NΔecd; E(spl)Δmγ-mβ DK33-10.1. Progeny underwent heat shock for 1 h at 37°C at 72 h after egg lay (AEL). Phenotypes were analysed 4 days later.
Mosaic analysis with a repressible clonal marker (MARCM)
For NΔecd-ctrl and NΔecd; Df(3R)E(spl)b32.2 MARCM clones, UAS-NΔecd; FRT82B πMyc (BDSC 1459) and UAS-NΔecd; FRT82B Df(3R)E(spl)b32.2 (BDSC 52011) were crossed to appropriate FRT aTub-Gal80 counter-chromosomes (Lee and Luo, 1999) combined with hs-FLP, aTub-Gal4, UAS-GFP for generating clones. Progeny underwent heat shock for 1 h at 37°C at 72 h AEL and CNSs were dissected out from wandering third instar larvae 4 days post clone induction.
Immunofluorescence
Fixation and immunohistochemistry of larval tissues were performed according to standard protocols. Fixation and immunohistochemistry of allograft tumour pieces were previously described (Magadi et al. 2020). Primary antibodies were guinea pig anti-Dpn [1:2000; (Magadi et al. 2020)]; mouse anti-Mira [1:100, (Ohshiro et al. 2000) courtesy of F.Matzuzaki]; mouse anti-Pros MR1A (1:50, Developmental Studies Hybridoma Bank, DSHB); rabbit anti-Ase (1:5000, courtesy of Y.N.Jan); rabbit anti‐PH3 (1:2000; Millipore/Sigma‐Aldrich,06‐570); rabbit anti‐GFP (1:10000; Minotech,701‐1); mouse anti‐GFP [1:100; DSHB,GFP‐G1 (J.R.Sanes/M.Yamagata)], rat-a‐Elav [1:300; DSHB,7E8A10(G.M.Rubin)], mouse anti‐Repo [1:50; DSHB,8D12(C.Goodman)]. Mouse, rabbit or guinea pig secondary antibodies were conjugated to Alexa 488, 555, 568, 633 or 647 (Molecular Probes) or to FiTC, Cy3 or Cy5 (Jackson ImmunoResearch). Samples were imaged on a Leica TCS SP8 confocal microscope (FORTH-IMBB).
Transplantation assay
Transplantation assays were performed as previously described by Rossi and Gonzalez (Rossi and Gonzalez, 2015) and as recently summarized in (Magadi et al. 2020). Briefly, donor hyperplastic larval brains were made either by generating GFP-positive, act-F/O clones or by exploiting flies carrying the aTub-Gal80ts, UAS-RedStinger; grhNB-Gal4 transgenes to overexpress different transgene combinations. Larval brains were dissected out, sliced into single brain lobes or single VNCs using forceps, loaded into a fine glass needle and injected into the abdomen of young female w1118 fly-hosts using a nanoinjector (Nanoject II Auto-Nanoliter Injector, Drummond Scientific Company, 3-000-205A). Host flies carrying allografts were kept at 25°C (GFP allografts) or 30°C (RFP allografts) and examined daily for viability and the presence of GFP/RFP in their abdomen and other tissues. Malignant GFP/RFP-positive tumour pieces (T0) were dissected out of the abdomen of host flies and were either serially re-transplanted into new host flies (T1) for up to three more passages (T3) or fixed with 4% formaldehyde (for 25 min at room temperature) and used for immunohistochemistry experiments according to standard protocols (Daskalaki et al. 2011). Alternatively, they were stored in Trizol for RNA extraction prior to RNA seq.
FACS purification and RNA extraction of dissociated larval NSC-like cells
Neural stem cell-like cells from larval brains were dissociated and isolated by FACS according to published protocols (Harzer et al. 2013). Briefly, 150 larvae carrying GFP positive act-F/O clones overexpressing UAS-HA-mγ, UAS-HA-dpn (DM)were washed once in cold PBS, once in 70% Ethanol and twice in cold PBS. Subsequently their brains were dissected out in ice cold Rinaldini solution 1x [Rinaldini 10X: 1.4M NaCl, 26 mM KCl, 4 mM NaH2PO4, 120 mM NAHCO3 and 50 mM Glucose] within a strict time window of less than 1 hour. Larval CNSs were subsequently washed in ice cold Rinaldini and incubated in Dissociation Solution [Collagenase 2 mg/ml (Sigma, C0130) in Complete Schneider’s Culture Medium [Schneider’s medium (GIBCO 21720–024), 1 mg/ml Glucose (D-L- glucose monohydrate) with 10% FBS (GIBCO, 10270-106), 1 mg/ml human insulin (Sigma, I9278) and 1x Antibiotic Antimycotic (GIBCO, 15240–062)] for 1 hour at RT. Larval brains were washed three times in Rinaldini 1x to remove Collagenase remnants. A volume of 200 μl of Rinaldini 1x supplemented with 10% FBS were subsequently added and the tissues were disrupted manually with gentle mechanical shearing using a pipette tip. For each sample, the cell suspension was filtered through a cell strainer (30μm mesh) into a 5ml FACS tube (BD falcon) and further diluted with 800μl of Rinaldini 1X with 10% FBS. Propidium Iodide was added to each sample at a final concentration of 0.5μg/ml.
Sorting of larval neural stem cell-like cells was performed on a BD FACS ARIA III using a 100-micron diameter nozzle at a sheath pressure of 20psi. Live, GFP-positive neural stem cell-like cells were sorted according to the gating strategy described in Fig. S5. Cells were sorted at an event rate of a maximum of 6,000 events per second into 15ml falcon tubes containing 1ml of Rinaldini solution 1x. Isolated cells were centrifuged at 300g for 5 min and the pellet was resuspended in 500μl of Trizol.
RNA-seq library Preparation
RNA was extracted with Trizol according to standard protocols. For each replica, RNA was extracted either from larval stem cell like-cells of 150 animals (DM FACS) or from allograft tumour tissues extracted from 25 adult host flies (DM T0 and DM T3). For the RNA-seq library preparation three replicates of each condition were needed.
NGS libraries were generated using total RNA as input with polyA mRNA magnetic isolation kit (NEB) and the NEB Ultra II RNA library kit for Illumina kit according to manufactures protocol, using 13 cycles of amplification. Libraries were sequenced on Illumina Nextseq 500 on 1 x 75 High flowcell.
Data analysis
Fastq files were downloaded from Illumina-BaseSpace and mapped to dm6 genes (iGenomes UCSC/dm6) using hisat2 version 2.1.0 (--score-min L 0,-0.5) (Kim et al. 2015). Bedgraphs were generated using genomecov (bedtools (Quinlan and Hall, 2010) v2.25.0) and uploaded in UCSC genome browser for visualization. The original data can be retrieved from NCBI GEO under accession number GSE179507.
Gene counts were computed with htseq-count (-s yes, version 0.11.2) (Anders et al. 2015). Differential analysis was performed with SARTools (version 1.5.1) (Varet et al. 2016) with default parameters. The edgeR analysis is presented in Fig. 5. GSEA ( (Mootha et al. 2003; Subramanian et al. 2005) analysis was performed with Dpn Chip-seq target genes from (Magadi et al. 2020) and the ranked genes based on fold change genes from the SARTools/edgeR RNA-seq analysis excluding genes that did not pass the testing criteria (NA). DEG genes at FDR 0.05 were used as input in Metascape (Zhou et al. 2019) to generate the collection of significantly enriched terms, shown in Fig. 5H and Table S4.
Supplementary Material
Supplementary Material 1
Table S1
Transcriptome analysis of T0 vs primary (FACS) DM tumours.
RNA-seq differential analysis complete output by SARTools/edgeR.
Table S2
Transcriptome analysis of T3 vs primary (FACS) DM tumours.
RNA-seq differential analysis complete output by SARTools/edgeR.
Table S3
Transcriptome analysis of T3 vs primary (FACS) DM tumours.
RNA-seq differential analysis complete output by SARTools/edgeR.
Table S4
Metascape analysis of GO terms enriched in DEG lists from allografted tumours compared to the primary (FACS) tumour.
Up- and down-regulated genes from T0 and T3 (4 lists) were used and are indicated in the output.
Acknowledgements
Cell sorting was performed at the InfrafrontierGR Infrastructure in the BSRC Fleming Flow Cytometry and Cell Sorting Unit. We thank the lab of E. Skoulakis at BSRC Fleming for hosting us during the preparation of the samples, and Kleopatra Dagla for assistance in cell sorting. We thank the Genomics Facility of IMBB for library preparation and sequencing. We thank Ioannis Livadaras for sharing his expertise on fly microinjections. This project has received funding from the Hellenic Foundation for Research and Innovation (HFRI) and the General Secretariat for Research and Technology (GSRT), under grant agreement No 2156 to EZ. Additional funding came from a Worldwide Cancer Research (WWCR) grant and a Fondation Santé grant to CD.
Abbreviations
ACD, Asymmetric Cell Division ; CNS, Central Nervous System ; CSCs, Cancer Stem Cells ; DM, Deadpan-E(spl)mγ ; FACS, fluorescence activated cell sorting ; GMCs, Ganglion Mother Cells ; Hes, Hairy and Enhancer of split ; NSCs, Neural Stem Cells ; NBs, Neuroblasts ; wt, wild-type ;References
Abdusselamoglu M. D., Landskron L., Bowman S. K., Eroglu E., Burkard T., Kingston R. E., Knoblich J. A., (2019). Dynamics of activating and repressive histone modifications in Drosophila neural stem cell lineages and brain tumors. Development dev.183400.
Almeida M. S., Bray S. J. (2005). Regulation of post-embryonic neuroblasts by Drosophila Grainyhead. Mechanisms of Development 122: 1282-1293.
Anders S., Pyl P. T., Huber W. (2015). HTSeq--a Python framework to work with high-throughput sequencing data. Bioinformatics 31: 166-169.
Azzarelli R., Simons B. D., Philpott A. (2018). The developmental origin of brain tumours: a cellular and molecular framework. Development 145: dev162693.
Babaoğlan A. B., Housden B. E., Furriols M., Bray S. J. (2013). Deadpan Contributes to the Robustness of the Notch Response. PLoS ONE 8: e75632.
Bello B., Reichert H., Hirth F. (2006). The brain tumor gene negatively regulates neural progenitor cell proliferation in the larval central brain of Drosophila . Development 133: 2639-2648.
Betschinger J., Mechtler K., Knoblich J. A. (2006). Asymmetric Segregation of the Tumor Suppressor Brat Regulates Self-Renewal in Drosophila Neural Stem Cells. Cell 124: 1241-1253.
Bonnay F., Veloso A., Steinmann V., Köcher T., Abdusselamoglu M. D., Bajaj S., Rivelles E., Landskron L., Esterbauer H., Zinzen R. P., Knoblich J. A. (2020). Oxidative Metabolism Drives Immortalization of Neural Stem Cells during Tumorigenesis. Cell 182: 1490-1507.e19.
Bowman S. K., Rolland V., Betschinger J., Kinsey K. A., Emery G., Knoblich J. A. (2008). The Tumor Suppressors Brat and Numb Regulate Transit-Amplifying Neuroblast Lineages in Drosophila. Developmental Cell 14: 535-546.
Caussinus E., Gonzalez C. (2005). Induction of tumor growth by altered stem-cell asymmetric division in Drosophila melanogaster. Nature Genetics 37: 1125-1129.
Choksi S. P., Southall T. D., Bossing T., Edoff K., de Wit E., Fischer B. E., van Steensel B., Micklem G., Brand A. H. (2006). Prospero Acts as a Binary Switch between Self-Renewal and Differentiation in Drosophila Neural Stem Cells. Developmental Cell 11: 775-789.
Couturier L., Mazouni K., Corson F., Schweisguth F. (2019). Regulation of Notch output dynamics via specific E(spl)-HLH factors during bristle patterning in Drosophila. Nature Communications 10: 3486.
Daskalaki A., Shalaby N. A., Kux K., Tsoumpekos G., Tsibidis G. D., Muskavitch M. A.T., Delidakis C. (2011). Distinct intracellular motifs of Delta mediate its ubiquitylation and activation by Mindbomb1 and Neuralized. Journal of Cell Biology 195: 1017-1031.
Eroglu E., Burkard T. R., Jiang Y., Saini N., Homem C. C.F., Reichert H., Knoblich J. A. (2014). SWI/SNF Complex Prevents Lineage Reversion and Induces Temporal Patterning in Neural Stem Cells. Cell 156: 1259-1273.
Fischer A., Gessler M. (2007). Delta Notch and then? Protein interactions and proposed modes of repression by Hes and Hey bHLH factors. Nucleic Acids Research 35: 4583-4596.
Froldi F., Szuperak M., Weng C.F., Shi W., Papenfuss A. T., Cheng L. Y. (2015). The transcription factor Nerfin-1 prevents reversion of neurons into neural stem cells. Genes & Development 29: 129-143.
Fuerstenberg S., Giniger E. (1998). Multiple Roles forNotchinDrosophilaMyogenesis. Developmental Biology 201: 66-77.
Gallant P. (2013). Myc Function in Drosophila. Cold Spring Harbor Perspectives in Medicine 3: a014324-a014324.
Genovese S., Clément R., Gaultier C., Besse F., Narbonne-Reveau K., Daian F., Foppolo S., Luis N. M., Maurange C. (2019). Coopted temporal patterning governs cellular hierarchy, heterogeneity and metabolism in Drosophila neuroblast tumors. eLife 8: e50375.
Hakes A. E., Brand A. H. (2019). Neural stem cell dynamics: the development of brain tumours. Current Opinion in Cell Biology 60: 131-138.
Harzer H., Berger C., Conder R., Schmauss G., Knoblich J. A. (2013). FACS purification of Drosophila larval neuroblasts for next-generation sequencing. Nature Protocols 8: 1088-1099.
Hatakeyama J., Bessho Y., Katoh K., Ookawara S., Fujioka M., Guillemot F., Kageyama R. (2004). Hes genes regulate size, shape and histogenesis of the nervous system by control of the timing of neural stem cell differentiation . Development 131: 5539-5550.
Havula E., Hietakangas V. (2018). Sugar sensing by ChREBP/Mondo-Mlx — new insight into downstream regulatory networks and integration of nutrient-derived signals. Current Opinion in Cell Biology 51: 89-96.
Hirata J., Nakagoshi H., Nabeshima Y., Matsuzaki F. (1995). Asymmetric segregation of the homeodomain protein Prospero duringDrosophila development. Nature 377: 627-630.
Homem C. C. F., Repic M., Knoblich J. A. (2015). Proliferation control in neural stem and progenitor cells. Nature Reviews Neuroscience 16: 647-659.
Homem C. C.F., Steinmann V., Burkard T. R., Jais A., Esterbauer H., Knoblich J. A. (2014). Ecdysone and Mediator Change Energy Metabolism to Terminate Proliferation in Drosophila Neural Stem Cells. Cell 158: 874-888.
Ikeshima-Kataoka H., Skeath J. B., Nabeshima Y., Doe C. Q., Matsuzaki F. (1997). Miranda directs Prospero to a daughter cell during Drosophila asymmetric divisions. Nature 390: 625-629.
Janic A., Mendizabal L., Llamazares S., Rossell D., Gonzalez C. (2010). Ectopic Expression of Germline Genes Drives Malignant Brain Tumor Growth in Drosophila . Science 330: 1824-1827.
Jüschke C., Dohnal I., Pichler P., Harzer H., Swart R., Ammerer G., Mechtler K., Knoblich J. A. (2013). Transcriptome and proteome quantification of a tumor model provides novel insights into post‐transcriptional gene regulation. Genome Biology 14: r133.
Kim D., Langmead B., Salzberg S. L. (2015). HISAT: a fast spliced aligner with low memory requirements. Nature Methods 12: 357-360.
Knoblich J. A. (2008). Mechanisms of Asymmetric Stem Cell Division. Cell 132: 583-597.
Knoblich J. A., Jan L. Y., Nung Jan Y. (1995). Asymmetric segregation of Numb and Prospero during cell division. Nature 377: 624-627.
Koe C. T., Li S., Rossi F., Wong J. J. L., Wang Y., Zhang Z., Chen K., Aw S. S., Richardson H. E., Robson P., Sung W.K., Yu F., Gonzalez C., Wang H. (2014). The Brm-HDAC3-Erm repressor complex suppresses dedifferentiation in Drosophila type II neuroblast lineages. eLife 3: e01906.
Landskron L., Steinmann V., Bonnay F., Burkard T. R., Steinmann J., Reichardt I., Harzer H., Laurenson A.S., Reichert H., Knoblich J. A. (2018). The asymmetrically segregating lncRNA cherub is required for transforming stem cells into malignant cells. eLife 7: e31347.
Lathia J. D., Mack S. C., Mulkearns-Hubert E. E., Valentim C. L.L., Rich J. N. (2015). Cancer stem cells in glioblastoma. Genes & Development 29: 1203-1217.
Lee C.Y., Wilkinson B. D., Siegrist S. E., Wharton R. P., Doe C. Q. (2006). Brat Is a Miranda Cargo Protein that Promotes Neuronal Differentiation and Inhibits Neuroblast Self-Renewal. Developmental Cell 10: 441-449.
Lee T. (2017). Wiring the Drosophila Brain with Individually Tailored Neural Lineages. Current Biology 27: R77-R82.
Lee T., Luo L. (1999). Mosaic Analysis with a Repressible Cell Marker for Studies of Gene Function in Neuronal Morphogenesis. Neuron 22: 451-461.
Magadi S. S., Voutyraki C., Anagnostopoulos G., Zacharioudaki E., Poutakidou I. K., Efraimoglou C., Stapountzi M., Theodorou V., Nikolaou C., Koumbanakis K. A., Fullard J. F., Delidakis C. (2020). Dissecting Hes-centred transcriptional networks in neural stem cell maintenance and tumorigenesis in Drosophila . Development 147: dev191544.
Mira H., Morante J. (2020). Neurogenesis From Embryo to Adult – Lessons From Flies and Mice. Frontiers in Cell and Developmental Biology 8: 533.
Mitchell K., Troike K., Silver D. J., Lathia J. D. (2021). The evolution of the cancer stem cell state in glioblastoma: emerging insights into the next generation of functional interactions. Neuro-Oncology 23: 199-213.
Mootha V. K., Lindgren C. M., Eriksson K.F., Subramanian A., Sihag S., Lehar J., Puigserver P., Carlsson E., Ridderstråle M., Laurila E., Houstis N., Daly M. J., Patterson N., Mesirov J. P., Golub T. R., Tamayo P., Spiegelman B., Lander E. S., Hirschhorn J. N., Altshuler D., Groop L. C. (2003). PGC-1α-responsive genes involved in oxidative phosphorylation are coordinately downregulated in human diabetes. Nature Genetics 34: 267-273.
Narbonne-Reveau K., Lanet E., Dillard C., Foppolo S., Chen C.H., Parrinello H., Rialle S., Sokol N. S., Maurange C. (2016). Neural stem cell-encoded temporal patterning delineates an early window of malignant susceptibility in Drosophila. eLife 5: e13463.
Neumüller R. A., Richter C., Fischer A., Novatchkova M., Neumüller K. G., Knoblich J. A. (2011). Genome-Wide Analysis of Self-Renewal in Drosophila Neural Stem Cells by Transgenic RNAi. Cell Stem Cell 8: 580-593.
Ohshiro T., Yagami T., Zhang C., Matsuzaki F. (2000). Role of cortical tumour-suppressor proteins in asymmetric division of Drosophila neuroblast. Nature 408: 593-596.
Quinlan A. R., Hall I. M. (2010). BEDTools: a flexible suite of utilities for comparing genomic features. Bioinformatics 26: 841-842.
Reichardt I., Bonnay F., Steinmann V., Loedige I., Burkard T. R., Meister G., Knoblich J. A. (2018). The tumor suppressor Brat controls neuronal stem cell lineages by inhibiting Deadpan and Zelda. EMBO reports 19: 102-117.
Rhyu M. S., Jan L. Y., Jan Y. N. (1994). Asymmetric distribution of numb protein during division of the sensory organ precursor cell confers distinct fates to daughter cells. Cell 76: 477-491.
Rossi F., Gonzalez C. (2015). Studying tumor growth in Drosophila using the tissue allograft method. Nature Protocols 10: 1525-1534.
Rossi F., Noren H., Jove R., Beljanski V., Grinnemo K.H. (2020). Differences and similarities between cancer and somatic stem cells: therapeutic implications. Stem Cell Research & Therapy 11: 489.
Samuels T. J., Arava Y., Järvelin A. I., Robertson F., Lee J. Y., Yang L., Yang C.P., Lee T., Ish-Horowicz D., Davis I. (2020). Neuronal upregulation of Prospero protein is driven by alternative mRNA polyadenylation and Syncrip-mediated mRNA stabilisation. Biology Open 9: bio049684.
San-Juán B. P., Baonza A. (2011). The bHLH factor deadpan is a direct target of Notch signaling and regulates neuroblast self-renewal in Drosophila. Developmental Biology 352: 70-82.
Sorge S., Theelke J., Yildirim K., Hertenstein H., McMullen E., Müller S., Altbürger C., Schirmeier S., Lohmann I. (2020). ATF4-Induced Warburg Metabolism Drives Over-Proliferation in Drosophila. Cell Reports 31: 107659.
Sousa-Nunes R., Cheng L. Y., Gould A. P. (2010). Regulating neural proliferation in the Drosophila CNS. Current Opinion in Neurobiology 20: 50-57.
Southall T. D., Davidson C. M., Miller C., Carr A., Brand A. H. (2014). Dedifferentiation of Neurons Precedes Tumor Formation in lola Mutants. Developmental Cell 28: 685-696.
Subramanian A., Tamayo P., Mootha V. K., Mukherjee S., Ebert B. L., Gillette M. A., Paulovich A., Pomeroy S. L., Golub T. R., Lander E. S., Mesirov J. P. (2005). Gene set enrichment analysis: A knowledge-based approach for interpreting genome-wide expression profiles. Proceedings of the National Academy of Sciences 102: 15545-15550.
Varet H., Brillet-Guéguen L., Coppée J.Y., Dillies M.A. (2016). SARTools: A DESeq2- and EdgeR-Based R Pipeline for Comprehensive Differential Analysis of RNA-Seq Data. PLOS ONE 11: e0157022.
Wang H., Somers G. W., Bashirullah A., Heberlein U., Yu F., Chia W. (2006). Aurora-A acts as a tumor suppressor and regulates self-renewal of Drosophila neuroblasts . Genes & Development 20: 3453-3463.
Weng M., Golden K. L., Lee C.Y. (2010). dFezf/Earmuff Maintains the Restricted Developmental Potential of Intermediate Neural Progenitors in Drosophila. Developmental Cell 18: 126-135.
Yang C.P., Samuels T. J., Huang Y., Yang L., Ish-Horowicz D., Davis I., Lee T. (2017). Imp and Syp RNA-binding proteins govern decommissioning of Drosophila neural stem cells . Development 144: 3454-3464.
Yoshida G. J. (2020). Beyond the Warburg Effect: N-Myc Contributes to Metabolic Reprogramming in Cancer Cells. Frontiers in Oncology 10: 791.
Zacharioudaki E., Falo Sanjuan J., Bray S. (2019). Mi-2/NuRD complex protects stem cell progeny from mitogenic Notch signaling. eLife 8: e41637.
Zacharioudaki E., Housden B. E., Garinis G., Stojnic R., Delidakis C., Bray S. (2016). Genes implicated in stem-cell identity and temporal-program are directly targeted by Notch in neuroblast tumours. Development 219: 219-231.
Zacharioudaki E., Magadi S. S., Delidakis C. (2012). bHLH-O proteins are crucial for Drosophila neuroblast self-renewal and mediate Notch-induced overproliferation . Development 139: 1258-1269.
Zhou Y., Zhou B., Pache L., Chang M., Khodabakhshi A. H., Tanaseichuk O., Benner C., Chanda S. K. (2019). Metascape provides a biologist-oriented resource for the analysis of systems-level datasets. Nature Communications 10: 1523.
Zhu S., Wildonger J., Barshow S., Younger S., Huang Y., Lee T. (2012). The bHLH Repressor Deadpan Regulates the Self-renewal and Specification of Drosophila Larval Neural Stem Cells Independently of Notch. PLoS ONE 7: e46724.